Gujarat BoardEnglish MediumSTD 12 SciencePhysicsNuclei3 Marks
Question
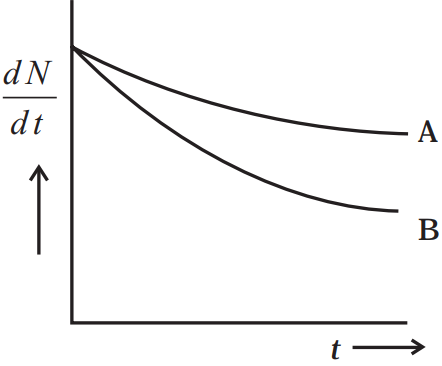
Which sample, A or B shown in Fig. has shorter mean-life?
✓
Answer
B has shorter mean life as $\lambda$ is greater for B. This can be explained mathematically as given below
From the given graph, at $\text{t}=0,\Big(\frac{\text{dN}}{\text{dt}}\Big)_\text{A}=\Big(\frac{\text{dN}}{\text{dt}}\Big)_\text{B}\Rightarrow\ (\text{N}_0)_\text{A}=(\text{N}_0)_\text{B}$
Considering any instant t by drawing a line perpendicular to time axis, we find that $\Big(\frac{\text{dN}}{\text{dt}}\Big)_\text{A}>\Big(\frac{\text{dN}}{\text{dt}}\Big)_\text{B}$
$\Rightarrow\ \lambda_\text{A}\text{N}_\text{A}>\lambda_\text{B}\text{N}_\text{B}$
$\because\ \text{N}_\text{A}>\text{N}_\text{B}$ (rate of decay of B is slower)
$\because\ \lambda_\text{B}>\lambda_\text{A}$
As, average life, $\tau=\frac{1}{\lambda}$
$\Rightarrow\ \tau_\text{A}>\tau_\text{B}$
Need a full question paper?
Generate a complete, print-ready paper with questions like this in minutes — across 16+ boards, with answer keys.