Question
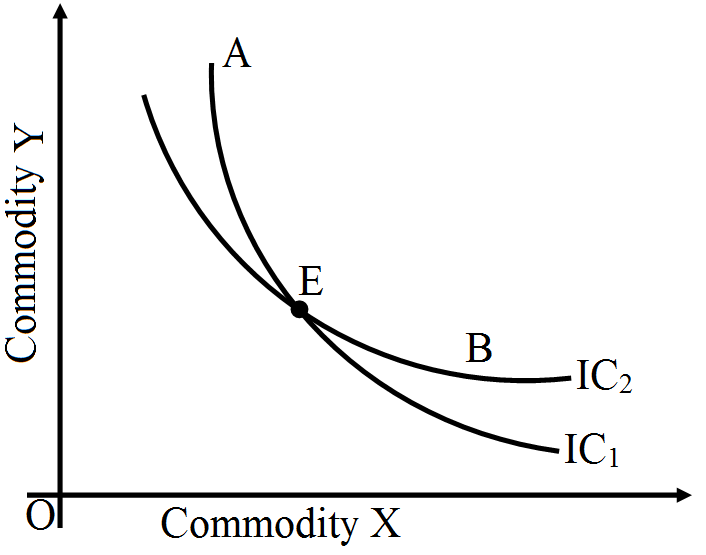
Why do Indifference curves not intersect each other?

Answer

  1. Two $\mathrm{IC}_{\mathrm{s}}$ cannot intersect each other. This property is proved by Contradict Method. First we assume that they intersect each other and then show that this assumption leads to an absurd conclusion. Let us assume that $I C_1$, intersects $I C_2$, at point $E$ shown in the figure given here.
  2. Let point $A$ be a point on $I C_1$, and point $B$ on $I C_2$. Since $A$ and $E$ lie on $I C_1$ the consumer will be indifferent De between points $E$ and $A(A=E)$. Similarly, $B$ and $E$ lie on $I C_2$, the consumer will be indifferent between points $E$ and $B(B=E)$.
  3. Based on the assumption of transitivity as $A=E$ and $B=E$, then the consumer must be indifferent between $A$ and $B(A=B)$ but this is not possible as $A$ and $B$ lie on two different $I C s$ and represent different levels of satisfaction. Therefore, $IC$ cannot intersect each other.

Need a full question paper?

Generate a complete, print-ready paper with questions like this in minutes — across 16+ boards, with answer keys.

Start Generating Free

Similar questions

From the following data on the cost of production of a firm, calculate:
  1. average fixed cost and.
  2. average variable cost of producing 8 units:
Output
0
3
8
TC ()
80
104
152
Consider a hypothetical demand and supply schedule of a commodity as given below:
Price of X (₹)
Demand (Units)
Supply (Units)
2 100 20
4 80 40
6 60 60
8 40 80
10 20 100
Draw a diagram and find the equilibrium price and equilibrium quantity.
Draw supply curves with price elasticity of supply throughout equal to:
  1. Zero.
  2. One.
  3. Infinity.
  4. Less than one.
Using supply and demand curves, show how an increase in the price of shoes affects the price of a pair of socks and the number of pairs of socks bought and sold.
When price of a good falls by 10 percent, its quantity demanded rises from 40 units to 50 units. Calculate price elasticity of demand by the percentage method.
Explain the effect of increase in income of buyers of a ‘normal’ commodity on its equilibrium price.
Calculate TR, AR and MR from the following data.
Price () 10 11 12 13 14 15 16
Units Sold - 9 - 7 - 5 -
TR (₹) 100 - 96 - 84 - 64
MR (₹) - - - - - - -
“A good sample is generally based on correctness and continuity”. In the context of above statement explain the characteristics of good sample.
Define variable cost. Explain the behaviour of total variable cost as output increases.
Compute the total revenue, marginal revenue and average revenue schedules in the following table. Market price of each unit of the good is Rs. $10$.
Quantity Sold
TR
MR
AR
0
1
2
3
4
5
6