Question
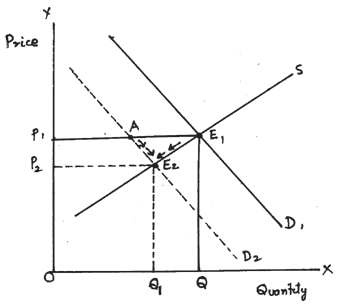
With the help of a diagram explain the effect of “decrease” in demand of a commodity on its equilibrium price and quantity.
Generate a complete, print-ready paper with questions like this in minutes — across 16+ boards, with answer keys.
| Output (Units) | MR(₹) | TC(₹) |
| 1 | 8 | 6 |
| 2 | 6 | 11 |
| 3 | 4 | 15 |
| 4 | 2 | 18 |
| 5 | 0 | 23 |
|
|
| Rs. Crores |
| | Wages and salaries | 1000 |
| | Net current transfers to abroad | 20 |
| | Net factor income paid to abroad | 10 |
| | Profit | 400 |
| | National debt interest | 120 |
| | Social security contributions by employers | 100 |
| | Current transfers from government | 60 |
| | National income accruing to government | 150 |
| | Rent | 200 |
| | Interest | 300 |
| | Royalty | 50 |
| Output (Units) | 1 | 2 | 3 | 4 | 5 | 6 |
| Average Revenue (Rs.) | 20 | 20 | 20 | 20 | 20 | 20 |
| Total Cost (Rs.) | 22 | 42 | 60 | 76 | 96 | 120 |
| ₹ (in crores) | ||
| (i) | Compensation of employees | 2,500 |
| (ii) | Profit | 700 |
| (iii) | Mixed income of self-employed | 7,500 |
| (iv) | Government final consumption expenditure | 3,000 |
| (v) | Rent | 400 |
| (vi) | Interest | 350 |
| (vii) | Net factor income from abroad | 50 |
| (viii) | Net current transfers to abroad | 100 |
| (ix) | Net indirect taxes | 150 |
| (x) | Depreciation | 70 |
| (xi) | Net exports | 40 |
| Price (₹) | 1 | 2 | 3 | 4 | 5 | 6 | 7 |
| Units Sold | 100 | 90 | 80 | 70 | 60 | 50 | 40 |