Question 11 Mark
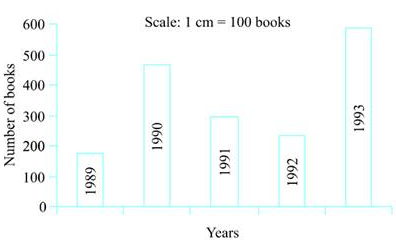
Read the bar graph (Fig) which shows the number of books sold by a bookstore during five consecutive years and answer the question: Can you explain how you would estimate the number of books sold in $1989?$

Answer
View full question & answer→From the graph, we can conclude that,
The number of books sold in the year $1989$ is about $1$ and $\frac{3}{4} \mathrm{th}$ part of $1 \ cm.$
Now, we know that,
The scale here is:
$1cm = 100$ books
Hence,
$100 + \frac{3}{4} \mathrm{th} \times$100$
$= 100 + 75 = 175$
The number of books sold in the year $1989$ is about $1$ and $\frac{3}{4} \mathrm{th}$ part of $1 \ cm.$
Now, we know that,
The scale here is:
$1cm = 100$ books
Hence,
$100 + \frac{3}{4} \mathrm{th} \times$100$
$= 100 + 75 = 175$