Questions

5 Marks Questions

Take a timed test

11 questions · self-marked practice — reveal the answer and mark yourself.

Question 15 Marks
Draw a graph for the following.
Side of square $($in $cm)$ $2$ $3$ $4$ $5$ $6$
Area $($in $cm^2)$ $4$ $9$ $16$ $25$ $36$
Is it a line graph?
Answer


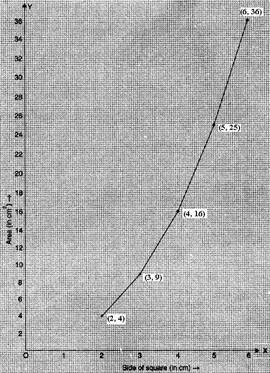
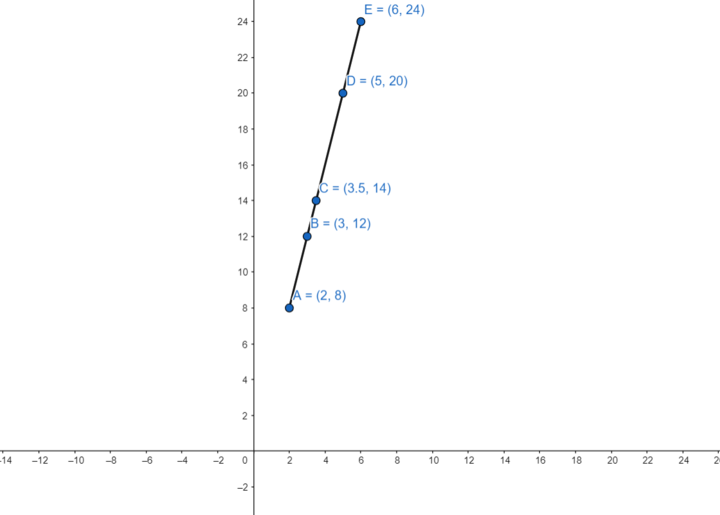
$i.$ Horizontal : $1$ unit $= 1\ cm$
Vertical : $1$ unit $= 2\ cm$
$ii.$ Mark side of the square $($in $cm)$ on horizontal axis.
$iii.$ Mark area (in $cm^2$) on vertical axis.
$iv.$ Plot the points $(2, 4), (3, 9), (4, 16), (5, 25), (6, 36).$
$v.$ Join the points.
The graph we get is not line.
View full question & answer
Question 25 Marks
Draw a graph for the points given. Is it a linear graph?
Side of a square (in cm) $2$ $3$ $3.5$ $5$ $6$
Perimeter (in cm) $8$ $12$ $14$ $20$ $24$
Answer
The given data can be represented in the form of graph as:
It is clear that points are in a straight line. Therefore, it is a linear graph.
View full question & answer
Question 35 Marks
Draw the graph for the following table of values, with suitable sales and Interest on deposits for a year on the axis.
Deposit $($in $₹)$ $1000$ $2000$ $3000$ $4000$ $5000$
Simple Interest $($in $₹)$ $80$ $160$ $240$ $320$ $400$
$i.$ Does the graph pass through the origin?
$ii.$ Use the graph to find the interest on $Rs. 2500$ for a year?
$iii.$To get an interest of $Rs. 280$ per year, how much money should be deposited?
Answer


$i.$ Yes! The graph passes through the origin.
$ii.$ Interest on $Rs. 2500$ for a year $= Rs. 200$
$iii.$ To get an interest of $Rs. 280$ per year, $Rs. 3500$ should be deposited.
View full question & answer
Question 45 Marks
Draw the graph for the following table of values , with suitable sales on the axis.Distance travelled by a car
Time $($in hours$)$ $6\ a.m.$ $7\ a.m.$ $8\ a.m.$ $9\ a.m.$
Distances $($in $km)$ $40$ $80$ $120$ $160$
$i.$ How much distances did the car cover during the period $7.30\ a.m.$ to $8\ a.m.$?
$ii.$ What was the time when the car had covered a distance of $100\ km$ since it's start?
Answer


$I.$ Horizontal : $2$ units $= 1$ hour
Vertical : $2$ units = $20\ km$
$II.$ Mark time $($in hours$)$ on horizontal axis.
$III.$ Mark distances $($in $km)$ on vertical axis.
$IV.$ Plot the points $(6\ a.m., 40), (7\ a.m., 80) (8\ a.m., 120), (9\ a.m., 160).$
$V.$ Join the points.
We get a linear graph.
$I.$ Distance covered during $7.30\ a.m.$ to $8\ a.m$.
$= 120\ km – 100\ km$ $= 20\ km$
$II.$ The time when the car had covered a distance of $100\ km$ since its start was $7.30\ a.m$.
View full question & answer
Question 55 Marks
Draw the graph for the following table of values , with suitable sales on the axis.Cost of apples.
Number of apples $1$ $2$ $3$ $4$ $5$
Cost $($in $₹)$ $5$ $10$ $15$ $20$ $25$
Answer


$i.$ Scale:
Horizontal : $2$ units $= 1$ apple
Vertical : $1$ unit $= Rs. 5$
$ii.$ Mark number of apples on horizontal axis.
$iii.$ Mark cost $($in $Rs.)$ on vertical axis.
View full question & answer
Question 65 Marks
Use the table below to draw line graph. Population (in thousands) of men and women in a village in different years.
Year $2003$ $2004$ $2005$ $2006$ $2007$
Number of Men $12$ $12.5$ $13$ $13.2$ $13.5$
Number of Women $11.3$ $11.9$ $13$ $13.6$ $12.8$
View full question & answer
Question 75 Marks
Use the table below to draw line graph. The number of days a hill side city received show in different years.
Year $2003$ $2004$ $2005$ $2006$
Days $8$ $10$ $5$ $12$
View full question & answer
Question 85 Marks
Ajit can ride a scooter constantly at a speed of $30 \text{kms/hour.}$ Draw a time$-$distance graph for this situation. Use it to find
$i.$ the time taken by Ajit to ride $75\ km$.
$ii.$ the distance covered by Ajit in $3 \frac{1}{2}$ hours.
Answer
Hours of ride Distance covered by scooter
$1$  hour $1\times30\ km = 30\ km$
$2$  hours $2\times30\ km = 60 km$
$3$  hours $3\times30\ km = 90\ km$
$4$  hours $4\times30\ km = 120\ km$ and so on.
We get a table of these values as follows:
Time $($in hours$)$ $1$ $2$ $3$ $4$
Distance covered $($in $km)$ $30$ $60$ $90$ $120$
$i.$ Scale: $($Fig$)$ Horizontal: $2$ units = $1$ hour, Vertical: $1$ unit $= 10\ km$
$ii.$ Mark time on the horizontal axis.
$iii.$ Mark distance on the vertical axis.
$iv.$ Plot the points: $(1, 30), (2, 60), (3, 90), (4, 120)$
$v.$ Join the points. We get a linear graph.
$a.$ Corresponding to $75\ km$ on the vertical axis, we get the time to be $2.5$ hours on the horizontal axis. Thus $2.5$ hours are needed to cover $75\ km.$
$b.$ Corresponding to $3 \frac{1}{2}$, hours on the horizontal axis, the distance covered is $105\ km$ on the vertical axis.
View full question & answer
Question 95 Marks
A bank gives $10\%$ Simple Interest $(S.I.)$ on deposits by senior citizens. Draw a graph to illustrate the relation between the sum deposited and simple interest earned. Find from your graph:
$i.$ the annual interest obtainable for an investment of $₹250$
$ii.$ the investment one has to make to get an annual simple interest of $₹70$
Answer
We know that simple interest $=  {P\times R \times T \over 100}$
Sum deposited Simple interest for a year
$₹100$ $₹\frac{100 \times 1 \times 10}{100}= ₹10$
$₹200$ $₹ \frac{200 \times 1 \times 10}{100}= ₹20$
$₹300$ $₹ \frac{300 \times 1 \times 10}{100}= ₹30$
$₹500$ $₹ \frac{500 \times 1 \times 10}{100}= ₹50$
$₹1000$ $₹100$
Steps to follow:
$i.$ Find the quantities to be plotted as Deposit and $SI$.
$ii.$ Decide the quantities to be taken on the $x-$axis and on the $y-$axis.
$iii.$ Choose a scale.
$iv.$ Plot points.
$v.$ Join the points.
We get a table of values.
Deposit $($in $₹)$ $100$ $200$ $300$ $500$ $1000$
Annual $S.I. ($in $₹)$ $10$ $20$ $30$ $50$ $100$
$i.$ Scale : $1$ unit $= ₹100$ on horizontal axis; $1$ unit $= ₹10$ on vertical axis.
$ii.$ Mark Deposits along horizontal axis.
$iii.$ Mark Simple Interest along the vertical axis.
$iv.$ Plot the points : $(100, 10), (200, 20), (300, 30), (500, 50)$ etc.
$v.$ Join the points. We get a graph that is a line $($Fig$).$
$a.$ Corresponding to $₹250$ on the horizontal axis, we get the interest to be $₹25$ on the vertical axis.
$b.$ Corresponding to $₹70$ on the vertical axis, we get the sum to be $₹700$ on the horizontal axis.
View full question & answer
Question 105 Marks
The following table gives the quantity of petrol and its cost. Plot a graph to show the data
No. of litres of petrol $10$ $15$ $20$ $25$
Cost of petrol in ₹ $500$ $750$ $1000$ $1250$
View full question & answer
Question 115 Marks
The given graph $($Fig$)$ describes the distances of a car from a city $P$ at different times when it is travelling from City $P$ to City $Q$, which are $350\ km$ apart. Study the graph and answer the following:
$i.$ What information is given on the two axes?
$ii.$ From where and when did the car begin its journey?
$iii.$ How far did the car go in the first hour?
$iv.$ How far did the car go during $(i)$ the $2^{nd}$ hour? $(ii)$ the $3$rd hour?
$v.$ Was the speed same during the first three hours? How do you know it?
$vi.$ Did the car stop for some duration at any place? Justify your answer.
$vii.$ When did the car reach City $Q$?
Answer
After observing the given graph carefully, it can be concluded that
$i.$ The horizontal $(x)$ axis shows the time. The vertical $(y)$ axis shows the distance of the car from City $P$.
$ii.$ The car started from City $P$ at $8\ a.m$.
$iii.$ The car travelled $50\ km$ during the first hour. $[$This can be seen as follows. At $8\ a.m$. it just started from City $P$.At $9\ a.m.$ it was at the $50^{th}\ km ($seen from graph$)$. Hence during the one$-$hour time between $8\ a.m.$ and $9\ a.m.$ the car travelled $50\ km].$
$iv.$ The distance covered by the car during $(a)$ the $2$nd hour $($i.e., from $9\ am$ to $10\ am)$ is $100\ km$, $(150 – 50)$. $(b)$ the $3\ rd$ hour $($i.e., from $10 am$ to $11\ am$) is $50\ km$ $(200 – 150)$.
$v.$ From the answers to questions $(iii)$ and $(iv)$, we find that the speed of the car was not the same all the time. $($In fact the graph illustrates how the speed varied$).$
$vi.$ We find that the car was $200\ km$ away from city $P$ when the time was $11\ a.m.$ and also at $12$ noon. This shows that the car did not travel during the interval $11\ a.m.$ to $12$ noon. The horizontal line segment representing “travel” during this period is illustrative of this fact.
$vii.$ The car reached City $Q$ at $2\ p.m$.
View full question & answer