Question 15 Marks
Following table gives the distribution of students of sections $A$ and $B$ of a class according to the marks obtained by them.
Represent the marks of the students of both the sections on the same graph by two frequency polygons.What do you observe?
|
Section A
|
Section B
|
||||||||||||||||||||||||||
|
Marks
|
Frequency
|
Marks
|
Frequency
|
||||||||||||||||||||||||
|
|
|
|
||||||||||||||||||||||||
Answer
View full question & answer→First, we find the mid marks of the given sections $A$ and $B$ by using the formula,
$\text{Class mark}=\frac{\text{Lower limit+Upper limit}}{2}$
So, the new table for section $A$ and Section $B$ is shown below:
We can draw a frequency polygon by plotting the class marks along the horizontal axis and the frequency along the vertical axis.
Now, plotting all the points $A(7, 5, 5), B(22.5, 12), C(37.5, 28), D(52.5, 30), E(67, 5, 35), F(82.5, 13)$ for section $A.$
Also, plotting all the points $H(7.5, 3), I(22.5, 16), J(37.5, 25), K(52.5, 27), L(67.5, 40)$ and $M(82.5, 10)$ for section $B.$
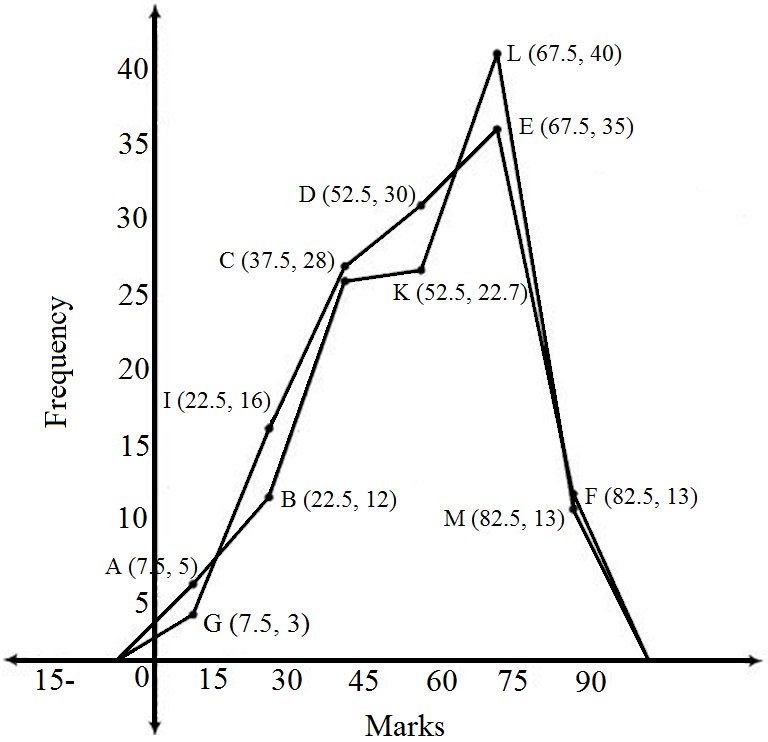
It is clear from the groph that maximum marks $67.5$ score by $40$ student in section $B.$
$\text{Class mark}=\frac{\text{Lower limit+Upper limit}}{2}$
So, the new table for section $A$ and Section $B$ is shown below:
|
Section A
|
Section B
|
||||||||||||||||||||||||||
|
Marks
|
Frequency
|
Marks
|
Frequency
|
||||||||||||||||||||||||
|
|
|
|
||||||||||||||||||||||||
Now, plotting all the points $A(7, 5, 5), B(22.5, 12), C(37.5, 28), D(52.5, 30), E(67, 5, 35), F(82.5, 13)$ for section $A.$
Also, plotting all the points $H(7.5, 3), I(22.5, 16), J(37.5, 25), K(52.5, 27), L(67.5, 40)$ and $M(82.5, 10)$ for section $B.$
It is clear from the groph that maximum marks $67.5$ score by $40$ student in section $B.$