Questions · Page 1 of 2

5 Marks Questions

🎯

Test yourself on this topic

50 questions · timed · auto-graded

Question 15 Marks
Calculate the missing frequency from the following distribution, it being given that the median of the distribution is 24.
Age (in years)
0-10
10-20
20-30
30-40
40-50
Number of persons
5
25
?
18
7
Answer
Age (in years)
Number of persons (f)
Cumulative frequency (cf)
0-10
5
5
10-20
25
30
20-30
x
30 + x
30-40
18
48 + x
40-50
7
55 + x
Median = 24
Hence, median class is 20-30
$\therefore\text{l}=20,\ \text{h}=10,\ \text{f}=\text{a},\ \text{cf}=$ cf of preceding class $=30,\ \frac{\text{N}}{2}=\frac{55+\text{a}}{2}$
Now, median $=\text{l}+\begin{Bmatrix}\text{h}\times\frac{\Big(\frac{\text{N}}{2}-\text{cf}\Big)}{\text{f}}\end{Bmatrix}$
$\Rightarrow24=20+\begin{Bmatrix}10\times\frac{\Big(\frac{55+\text{a}}{2}-30\Big)}{2}\end{Bmatrix}$
$\Rightarrow4=10\times\frac{55+\text{a}-60}{2\text{a}}$
$\Rightarrow4=5\times\frac{\text{a}-5}{\text{a}}$
$\Rightarrow4\text{a}=5\text{a}-25$
$\Rightarrow\text{a}=25$
Thus, yhe missung frequency is 25.
View full question & answer
Question 25 Marks
Given below is the distribution of total household expenditure of 200 manual workers in a city:
Expenditure (in Rs) No. of manual workers
1000-1500 24
1500-2000 40
2000-2500 31
2500-3000 28
3000-3500 32
3500-4000 23
4000-4500 17
4500-5000 5
Find the expenditure done by maximum number of manual workers.
Answer
As the class 1500-2000 has the maximum frequency, it is the modal class.
Now, $\text{x}_\text{k}=1500,\ \text{h}=500,\ \text{f}_\text{k}=40,\ \text{f}_{\text{k}-1}=24,\ \text{f}_{\text{k}+1}=31$
$\therefore$ Mode, $\text{M}_0=\text{x}_\text{k}+\Big\{\text{h}\times\frac{(\text{f}_\text{k}-\text{f}_\text{k}-1)}{(2\text{f}_\text{k}-\text{f}_{\text{k}-1}-\text{f}_{\text{k}+1})}\Big\}$
$=1500+\Big\{500\times\frac{(40-24)}{2\times40-24-31}\Big\}$
$=1500+\Big\{500\times\frac{16}{25}\Big\}$
$=(1500+320)$
$=1820$
Hence, mode = Rs. 1820
View full question & answer
Question 35 Marks
If the mean of the following distribution is 27, find the value of p.
Class
0-10
10-20
20-30
30-40
40-50
Frequency
8
p
12
13
10
Answer
Class interval
Frequency ($f_i$​​​​​​​)
Mid-value ($x_i​​​​​​​$)
$f_i \times x_i$
0-10
8
5
40
10-20
p
15
15p
20-30
12
25
300
30-40
13
35
455
40-50
10
45
450
Total
$\sum\text{f}_\text{i}=43+\text{p}$
 
$\sum\text{f}_\text{i}\text{x}_\text{i}=1245+15\text{p}$
Now, mean $=\frac{\sum\text{f}_\text{i}\text{x}_\text{i}}{\sum\text{f}_\text{i}}$
$\Rightarrow27=\frac{1245+15\text{p}}{43+\text{p}}$
$\Rightarrow27(43+\text{p})=1245+15\text{p}$
$\Rightarrow1161+27\text{p}=1245+15\text{p}$
$\Rightarrow12\text{p}=84$
$\Rightarrow\text{p}=7$
View full question & answer
Question 45 Marks
The following are the ages of 300 patients getting medical treatment in a hospital on a particular day:
Age (in years)
10-20
20-30
30-40
40-50
50-60
60-70
Number of patients
60
42
55
70
53
20
Form a 'less than type' cumulative frequency distribution.
Answer
Age (in years)
Cumulative frequency (cf)
Less than 20
60
Less than 30
102
Less than 40
157
Less than 50
227
Less than 60
280
Less than 70
300
View full question & answer
Question 55 Marks
In an annual examination, marks (out of 90) obtained by students of class X in mathematics are given below:
Marks obtained 0-15 15-30 30-45 45-60 60-75 75-90
Number of students 2 4 5 20 9 10
Find the mean marks.
Answer
Class interval
Frequency $f_i$
Mid-value $x_i$
$\text{u}_\text{i}=\frac{\text{x}_\text{i}-\text{A}}{\text{h}}=\frac{\text{x}_\text{i}-52.5}{15}$
$f_i \times u_i$
0-15 2 7.5 -3 -6
15-30
4
22.5 -2 -8
30-45
5 37.5 -1 -5
45-60
20 52.5 = a 0 0
60-75
9 67.5 1 9
60-75
10
82.5
2
20
 
$\sum\text{f}_\text{i}=50$
 
 
$\sum\text{f}_\text{i}\text{u}_\text{i}=10$
Thus, $\text{A}=52.5,\ \text{h}=15,\ \sum\text{f}_\text{i}=50$ and $\sum\text{f}_\text{i}\text{u}_\text{i}=10$
Mean $=\text{A}+\Big\{\text{h}\times\frac{\sum\text{f}_\text{i}\text{u}_\text{i}}{\sum\text{f}_\text{i}}\Big\}$
$52.5+\Big\{15\times\frac{10}{50}\Big\}$
$=52.5+3$
$=55.5$
Thus, the mean marks are 55.5.
View full question & answer
Question 65 Marks
Compute the mode of the following data:
Class
0-20
20-40
40-60
60-80
80-100
Frequency
25
16
28
20
5
Answer
Here the maximum class frequency is 28, and the class corresponding to this frequency is 40-60. So, the modal class is 40-60.
Now,
modal class = 40-60, lower limit(l) of modal class = 40, class size (h) = 20,
frequency $(f_1)$ of the modal class = 28,
frequency $(f_0)$ of class preceding the modal class = 16,
frequency $(f_2)$ of class succeeding the modal class = 20
Now, let us substitute these values in the formula:
Mode $=\text{l}+\Big(\frac{\text{f}_1-\text{f}_0}{2\text{f}_1-\text{f}_0-\text{f}_2}\Big)\times\text{h}$
$=40+\Big(\frac{28-16}{56-16-20}\Big)\times20$
$=40+\Big(\frac{12}{20}\Big)\times20$
$=30+12$
$=52$
Hence, the mode is 52.
View full question & answer
Question 75 Marks
Find the mean age from the following frequency distribution:
Age (in years) 25-29 30-34 35-39 40-44 45-49 50-54 55-59
No. of person 4 14 22 16 6 5 3
Answer
The given series in an inclusive, series, making it an exclusive, we have
Class
Frequency $f_i$
Mid-value $x_i$
$\text{u}_\text{i}=\frac{\text{x}_\text{i}-\text{42}}{\text{5}}$
$(f_i \times u_i)$
24.5-29.5
4 27 -3 -12
29.5-34.5
14
32 -2 -28
34.5-39.5
22
37 -1 -22
39.5-44.5
16 42 = A 0 0
44.5-49.5 6 47 1 6
49.5-54.5
5
52
2
10
49.5-54.5 3 57 3 9
 
$\sum\text{f}_\text{i}=70$
 
 
$\sum\text{f}_\text{i}\text{u}_\text{i}=-37$
Thus, $\text{A}=42,\ \text{h}=5,\ \sum\text{f}_\text{i}=40,$ and $\sum\text{f}_\text{i}\text{u}_\text{i}=-37$
$\therefore$ Mean $\bar{\text{x}}=\text{A}+\Big[\text{h}\times\frac{\sum\text{(f}_\text{i}\times\text{u}_\text{i})}{\sum\text{f}_\text{i}}\Big]$
$=42+\Big(5\times\frac{-37}{70}\Big)$
$=42-2.64$
$=39.36\text{ years}$
Hence, mean = 39.36 years
View full question & answer
Question 85 Marks
??The following table gives the life-time (in days) of 100 electric bulbs of a certain brand.
Life-time (in days)
Less than 50
Less than 100
Less than 150
Less than 200
Less than 250
Less than 300
Number of bulbs
7
21
52
79
91
100
From this table, construct the frequency distribution table.
Answer
Life-time (in days)
Frequency (f)
0-50
7
50-100
14
100-150
31
150-200
27
200-250
12
250-300
9
View full question & answer
Question 95 Marks
Find the mean of the following data, using step-deviation method.
Class
5-15
15-25
25-35
35-45
45-55
55-65
65-75
Frequency
6
10
16
15
24
8
7
Answer
Class interval
Frequency $f_i$
Mid-value $x_i$
$d_i = x_i − 25$
$\text{u}_\text{i}=\frac{\text{x}_\text{i}-\text{A}}{\text{h}}=\frac{\text{x}_\text{i}-40}{10}$
$f_i \times u_i$
5-15
6 10
-30
-3
-18
15-25
10
20
-20
-2
-20
25-35
16
30
-10
-1 -16
35-45
15 40
0
0 0
45-55
24
50
10
1 24
55-65 8 60 20 2 16
65-75 7 70 30 3 21
 
$\sum\text{f}_\text{i}=86$


$\sum\text{f}_\text{i}\text{u}_\text{i}=7$
Thus, $\text{A}=40,\ \text{h}=10,\ \sum\text{f}_\text{i}=86$ and $\sum\text{f}_\text{i}\text{u}_\text{i}=7$
Mean $=\text{A}+\Big\{\text{h}\times\frac{\sum\text{f}_\text{i}\text{u}_\text{i}}{\sum\text{f}_\text{i}}\Big\}$
$40+\Big\{10\times\frac{7}{86}\Big\}$
$=40+0.81$
$=40.81$
View full question & answer
Question 105 Marks
In a hospital, the ages of diabetic patients were recorded as follows. Find the median age.
Age (in years) 0-15 15-30 30-45 45-60 60-75
Number of patients 5 20 40 50 25
Answer
We prepare the cumulative frequency table, as shown below:
Age (in years)
Number of patients ($f_i$​​​​​​​)
Cumulative Frequency (cf)
0-15
5
5
15-30
20
25
30-45
40
65
45-60
50
115
60-75
25
140
Total
$\text{N}=\sum\text{f}_\text{i}=140$
 
Now, $\text{N}=140\Rightarrow\frac{\text{N}}{2}=70.$
The cumulative frequency just greater than 70 is 115 and the corresponding class is 45-60.
Thus, the median class is 45-60.
$\therefore\text{l}=45,\ \text{h}=15,\text{f}=50,\ \text{N}=140$ and $\text{cf}=65$
Now,
Median $=\text{l}+\bigg(\frac{\frac{\text{N}}{2}-\text{cf}}{\text{f}}\bigg)\times\text{h}$
$=45+\bigg(\frac{\frac{140}{2}-65}{50}\bigg)\times15$
$=45+\Big(\frac{70-65}{50}\Big)\times15$
$=45+1.5$
$=46.5$
Hence, the median age is 46.5 years.
View full question & answer
Question 115 Marks
During a medical check-up, the number of heartbeats per minute of 30 patients were recorded and summarised as follows:
Number of heartbeats per minute 65-68 68-71 71-74 74-77 77-80 80-83 83-86
Number of patients 2 4 3 8 7 4 2
Mean, median, mode of grouped data, cumulative frequency graph and ogive.
Find the mean heartbeats per minute for these patients, choosing a suitable method.
Answer
Class intercal
Frequency $f_i$
Mid-value $x_1$
Deviation $d_i = x_i- 75.5$
$f_1 \times d_1$
65-68
2
66.5
-9
-18
68-71
5
69.5
-6
-24
71-74
3
72.5
-3
-9
74-77
8
75.5 = A
0
0
77-80
7
78.5
3
21
80-83
4
81.5
6
24
83-86
2
84.5
9
18
Total
$\sum\text{f}_\text{i}=30$
 
 
$\sum\text{f}_\text{i}\text{d}_\text{i}=12$
Thus, $\text{A}=75.5,\sum\text{f}_\text{i}=30$ and $\sum\text{f}_\text{i}\text{d}_\text{i}=12$
Mean $=\text{A}+\frac{\sum\text{f}_\text{i}\text{d}_\text{i}}{\sum\text{f}_\text{i}}$
$=75.5+\frac{12}{30}$
$=75.5+0.4$
$=75.9$
Thus, the mean heartbeats per minute for these patient is 75.9.
View full question & answer
Question 125 Marks
Calculate the mode from the following data:
Monthly salary (in Rs)
No. of employees
0-5000
90
5000-1000
150
10000-15000
100
15000-20000
80
20000-25000
70
25000-30000
10
Answer
As the class 5000-10000 has the maximum frequency, it is the modal class.
Now, $\text{x}_\text{k}=5000,\ \text{h}=5000,\ \text{f}_\text{k}=150,\ \text{f}_{\text{k}-1}=90,\ \text{f}_{\text{k}+1}=100$
$\therefore$ Mode, $\text{M}_0=\text{x}_\text{k}+\Big\{\text{h}\times\frac{(\text{f}_\text{k}-\text{f}_\text{k}-1)}{(2\text{f}_\text{k}-\text{f}_{\text{k}-1}-\text{f}_{\text{k}+1})}\Big\}$
$=5000+\Big\{5000\times\frac{(150-90)}{2\times150-90-100}\Big\}$
$=5000+\Big\{5000\times\frac{60}{110}\Big\}$
$=(5000+2727.27)$
$=7727.27$
Hence, mode = Rs. 7727.27
View full question & answer
Question 135 Marks
Find the mean of the following data, using direct method:
Class
0-10
10-20
20-30
30-40
40-50
50-60
Frequency
7
5
6
12
8
2
Answer
We have
Class
Frequency $f_i$
Frequency $f_i$
$f_ix_i$
0-10
7
5
35
10-20
5
15
75
20-30
6
25
150
30-40
12
35
420
40-50
8
45
360
50-60
2
55
110
 
$\sum\text{f}_\text{i}=40$
 
$\sum\text{f}_\text{i}\text{x}_\text{i}=1150$
$\therefore$ Mean $\bar{\text{x}}=\frac{\sum(\text{f}_\text{i}\times\text{x}_\text{i})}{\sum\text{f}_\text{i}}=\frac{1150}{40}=28.75$
View full question & answer
Question 145 Marks
Calculate the median from the following frequency distribution:
Class 5-10 10-15 15-20 20-25 20-30 30-35 35-40 40-45
Frequency 5 6 15 10 5 4 2 2
Answer
Class
Frequency (f)
Cumulative Frequency
5-10
5
5
10-15
6
11
15-20
15
26
20-25
10
36
25-30
5
41
30-35 4 45
35-40 2 47
40-45 2 49
 
$\text{N}=\sum\text{f}=49$
 
$\text{N}=49$
$\Rightarrow\frac{\text{N}}{2}=24.5$
The cumulative frequency just greater than 24.5 is 26 and the corresponding class is 15-20.
Thus, the median class is 15-20
$\therefore$ Medien, $\text{M}=\text{l}+\Bigg\{\text{h}\times\frac{\Big(\frac{\text{N}}{2}-\text{c.f}\Big)}{\text{f}}\Bigg\}$
$=15+\Big\{5\times\frac{(24.5-11)}{15}\Big\}$
$=15+4.5$
$=19.5$
Hence, median = 19.5
View full question & answer
Question 155 Marks
Using an appropriate method, find the mean of following frequency distribution:
Class interval
84-90
90-96
96-102
102-108
108-114
114-120
Frequency
8
10
16
23
12
11
Which method did you use, and why?
Answer
Class interval
Frequency $f_i$
Mid-value $x_i$
$\text{u}_\text{i}=\frac{\text{x}_\text{i}-\text{A}}{\text{h}}=\frac{\text{x}_\text{i}-99}{6}$
$f_i \times u_i$
84-90
8
87
-2
-16
90-96
10
93
-1
-20
960-102
16
99 = A
0
0
102-108
23
105
1
23
108-114
12
111
2
24
114-120
11
117
3
33
Total
$\sum\text{f}_\text{i}=80$
 
 
$\sum\text{f}_\text{i}\text{u}_\text{i}=44$
Thus, $\text{A}=99,\ \text{h}=6,\ \sum\text{f}_\text{i}=80$ and $\sum\text{f}_\text{i}\text{u}_\text{i}=44$
Mean $=\text{A}+\Big\{\text{h}\times\frac{\sum\text{f}_\text{i}\text{u}_\text{i}}{\sum\text{f}_\text{i}}\Big\}$
$=99+\Big\{6\times\frac{44}{80}\Big\}$
$=99+3.3$
$=102.3$
Since the values of $x_i' s f_i'$ s are larger, we use step-deviation method.
View full question & answer
Question 165 Marks
In the following data, find the values of p and q. Also, find the median class and modal class.
Class
Frequency (f)
Cumulative frequency (cf)
100-200
11
11
200-300
12
p
300-400
10
33
400-500
q
46
500-600
20
66
600-700
14
80
Answer
p = frequency of the dass + cf of preceding class
= 12 + 11
= 23
q = cf of the cless - cf of preceding class
= 46 - 33
= 13
Thus, we have
Class interval
Frequency
Cumulative frequency
100-200
11
11
200-300
12
23
300-400
10
33
400-500
13
46
500-600
20
66
600-700
14
80
$\text{N}=80\Rightarrow\frac{\text{N}}{2}=40$
The cumulative frequency just greater then 40 rs 46.
Hence, median class is 400-500.
Here, maximum frequency = 20
Hence, Modal class is 500-600.
Thus, the cumulaove frequency of modal class is 53.
View full question & answer
Question 175 Marks
The agewise participation of students in the Annual Function of a school is shown in the following distribution.
Age (in years) 5-7 7-9 9-11 11-13 13−15 15−17 17−19
Number of students x 15 18 30 50 48 x
Find the missing frequencies when the sum of frequencies is 181. Also, find the mode of the data.
Answer
It is given that the sum of frequencies is 181.
$\therefore\text{x}+15+18+30+50+48+\text{x}=181$
$\Rightarrow2\text{x}+161=181$
$\Rightarrow2\text{x}=181-161$
$\Rightarrow2\text{x}=20$
$\Rightarrow\text{x}=10$
Thus, $\text{x}=10$
Here the maximum class frequency is 50, and the class corresponding to this frequency is 13-15. So, the modal class is 13-15.
Now,
Modal class = 13-15, lower limit (l) of modal class = 13, class size (h) = 2,
frequency $(f_1)$ of the modal class = 50,
frequency $(f_0)$ of class preceding the modal class = 30,
frequency $(f_1)$ of class succeeding the modal class = 48.
Now, let us substitute these values in the formula:
Mode, $=\text{l}+\Big(\frac{\text{f}_1-\text{f}_0}{2\text{f}_1-\text{f}_0-\text{f}_2}\Big)\times\text{h}$
$=13+\Big(\frac{50-30}{100-30-48}\Big)\times2$
$=13+\Big(\frac{20}{22}\Big)\times2$
$=13+1.82$
$=14.82$
Hence, mode = Rs. 14.82
View full question & answer
Question 185 Marks
Given below is the number of units of electricity consumed in a week in a certain locality:
Consumption (in units) 65-85 85-105 105-125 125-145 145-165 165-185 195-205
Number of consumers 4 5 13 20 14 7 4
Calculate the median
Answer
Class
Frequency (f)
Cumulative Frequency
65-85
4
4
85-105
5
9
105-125
13
22
125-145
20
42
145-165
14
56
165-185
7
63
185-205
4
67
 
$\text{N}=\sum\text{f}=67$
 
$\text{N}=67$
$\Rightarrow\frac{\text{N}}{2}=33.5$
The cumulative frequency just greater than 33.5 is 42 and the corresponding class is 125-145.
Thus, the median class is 125.145.
$\therefore$ Medien, $\text{M}=\text{l}+\Bigg\{\text{h}\times\frac{\Big(\frac{\text{N}}{2}-\text{c.f}\Big)}{\text{f}}\Bigg\}$
$=125+\Big\{20\times\frac{(33.5-22)}{20}\Big\}$
$=125+11.5$
$=136.5$
Hence, median = 136.5
View full question & answer
Question 195 Marks
Calculate the median from the following data:
Height (in cm)
135-140
140-145
145-150
150-155
155-160
160-165
165-170
170-175
No. of boys
6
10
18
22
20
15
6
3
Answer
Class
Frequency (f)
Cumulative Frequency
135-140
6
6
140-145
10
16
145-150
18
34
150-155
22
56
155-160
20
76
160-165
15
91
165-170
6
97
170-175
3
100
 
$\text{N}=\sum\text{f}=400$
 
$\text{N}=100$
$\Rightarrow\frac{\text{N}}{2}=50$
The cumulative frequency just greater than 50 is 56 and the corresponding class is 150-155.
Thus, the median class is 150-155
$\therefore$ Medien, $\text{M}=\text{l}+\Bigg\{\text{h}\times\frac{\Big(\frac{\text{N}}{2}-\text{c.f}\Big)}{\text{f}}\Bigg\}$
$=150+\Big\{5\times\frac{(50-34)}{22}\Big\}$
$=150+3.64$
$=153.64$
Hence, median = 153.64
View full question & answer
Question 205 Marks
In the following data the median of the runs scored by 60 top batsmen of the world in one-day international cricket matches is 5000. Find the missing frequencies x and y.
Runs scored
2500-3500
3500-4500
4500-5500
5500-6500
6500-7500
7500-8500
Number of batsmen
5
x
y
12
6
2
Answer
We prepare the cumulative frequency table, as shown below:
Runs scored
Number of batsmen ($f_i$​​​​​​​)
Cumulative frequency (cf)
2500-350
12
5
350-4500
a
5 + x
4500-5500
12
5 + x + y
5500-6500
15
17 + x + y
6500-7500
b
23 + x + y
7500-8500
6
25 + x + y
Total
$\text{N}=\sum\text{f}_\text{i}=60$
 
Let x and y be the missing frequencies of class intervals 3500-4500 and 4500-5500 respectively. Then,
25 + x + y = 60 = x + y = 35 .....(1)
Median is 5000, which lies in 4500-5500. So, the median class is 4500-5500.
$\therefore\text{l}=4500,\ \text{h}=1000,\ \text{N}=60,\ \text{f}=\text{y}$ and $\text{cf}=5+\text{x}$
Now,
Median $=\text{l}+\bigg(\frac{\frac{\text{N}}{2}-\text{cf}}{\text{f}}\bigg)\times\text{h}$
$\Rightarrow5000=4500+\bigg(\frac{\frac{60}{2}-(5+\text{x})}{\text{y}}\bigg)\times1000$
$\Rightarrow5000=4500=\Big(\frac{30-5-\text{x}}{\text{x}}\Big)\times1000$
$\Rightarrow500=\Big(\frac{25-\text{x}}{\text{y}}\Big)\times1000$
$\Rightarrow\text{y}=50-2\text{x}$
$\Rightarrow35=\text{x}=50-2\text{x}$ [From (1)]
$\Rightarrow2\text{x}=\text{x}=50-35$
$\Rightarrow\text{x}=15$
$\therefore\text{y}=35-\text{x}$ [From (1)]
$\Rightarrow\text{y}=35-15$
$\Rightarrow\text{y}=20$
Hence, y = 15 and b= 20.
View full question & answer
Question 215 Marks
Calculate the mean of the following data, using direct method:
Class
25-35
35-45
45-55
55-65
65-75
Frequency
6
10
8
12
4
Answer
We have
Class
Frequency $f_i$
Frequency $x_i$
$f_ix_i$
25-35
6
30
180
35-45
10
40
400
45-55
8
50
400
55-65
12
60
720
65-75
4
70
280
  $\sum\text{f}_\text{i}\text{x}_\text{i}=40$   $\sum\text{f}_\text{i}\text{x}_\text{i}=1980$
$\therefore$ Mean $\bar{\text{x}}=\frac{\sum(\text{f}_\text{i}\text{x}_\text{i})}{\sum\text{f}_\text{i}}=\frac{1980}{40}=49.5$
View full question & answer
Question 225 Marks
Find the mode of the following frequency distribution:
Marks
10-20
20-30
30-40
40-50
50-60
Frequency
12
35
45
25
13
Answer
Here the maximum class frequency is 45, and the class corresponding to this frequency is 30-40. So, the modal class is 30-40.
Now,
modal class = 30-40, lower limit(l) of modal class = 30, class size (h) = 10,
frequency ($f_1$​​​​​​​) of the modal class = 45,
frequency ($f_0​​​​​​​$​​​​​​​) of class preceding the modal class = 35,
frequency ($f_2​​​​​​​$​​​​​​​) of class succeeding the modal class = 25
Now, let us substitute these values in the formula:
Mode $=\text{l}+\Big(\frac{\text{f}_1-\text{f}_0}{2\text{f}_1-\text{f}_0-\text{f}_2}\Big)\times\text{h}$
$=30+\Big(\frac{45-35}{90-35-25}\Big)\times10$
$=30+3.33$
$=33.33$
Hence, the mode is 33.33.
View full question & answer
Question 235 Marks
Find the mean of the following frequency distribution using a suitable method.
Class
20-30
30-40
40-50
50-60
60-70
Frequency
25
40
42
33
10
Answer
Class interval
Frequency $f_i$
Mid-value $x_i$
$\text{u}_\text{i}=\frac{\text{x}_\text{i}-\text{A}}{\text{h}}=\frac{\text{x}_\text{i}-203.5}{1}$
$f_i \times u_i$
20-30
25 25 -20 -500
30-40
40
35 -10 -400
40-50
42
45 = A 0 0
50-60
33 55 10 330
60-70
10 65 20 200
 
$\sum\text{f}_\text{i}=150$
 
 
$\sum\text{f}_\text{i}\text{u}_\text{i}=-370$
Thus, $\text{A}=45,\ \sum\text{f}_\text{i}=150$ and $\sum\text{f}_\text{i}\text{u}_\text{i}=-370$
Mean $=\text{A}+\Big\{\text{h}\times\frac{\sum\text{f}_\text{i}\text{u}_\text{i}}{\sum\text{f}_\text{i}}\Big\}$
$45+\frac{(-370)}{150}$
$=45-2.47$
$=42.53$
View full question & answer
Question 245 Marks
Heights of students of Class X are given in the foloowing frequency distribution:
Height (in cm) 150-155 155-160 160-165 165-170 170-175
Number of students 15 8 20 12 5
Find the modal height.
Also, find the mean height. Compare and interpret the two measures of central tendency.
Answer
Here the maximum class frequency is 20, and the class corresponding to this frequency is 160-165. So, the modal class is 160-165.
Now,
modal class = 160-165, lower limit(l) of modal class = 160, class size (h) = 5,
frequency ($f_1$) of the modal class = 20,
frequency ($f_0​​​​​​​$​​​​​​​) of class preceding the modal class = 18,
frequency ($f_2​​​​​​​$​​​​​​​) of class succeeding the modal class = 12
Now, let us substitute these values in the formula:
Mode $=\text{l}+\Big(\frac{\text{f}_1-\text{f}_0}{2\text{f}_1-\text{f}_0-\text{f}_2}\Big)\times\text{h}$
$=160+\Big(\frac{20-8}{40-8-12}\Big)\times5$
$=160+\Big(\frac{12}{20}\Big)\times5$
$=160+3$
$=163$
Hence, the mode is 163.
It represents that the height of maximum number of students is 163cm.
Now, to find the mean let us put the data in the table given below:
Height (in cm)
Number of students ($f_i​​​​​​​$)
Class mark ($x_i​​​​​​​$)
$f_ix_i$
150-155
15
152.5
2287.5
155-160
8
157.5
1260
160-165
20
162.5
3250
165-170
12
167.5
2010
170-175
5
172.5
862.5
Total
$\sum\text{f}_\text{i}=60$
 
$\sum\text{f}_\text{i}\text{x}_\text{i}=9670$
Mean $=\frac{\sum_\limits\text{i}\text{f}_\text{i}\text{x}_\text{i}}{\sum_\limits\text{i}\text{f}_\text{i}}$
$=\frac{9670}{60}$
$=161.17$
Thus, mean of the given data is 161.17.
It represents that on an average, the height of a student is 161.17cm.
View full question & answer
Question 255 Marks
Find the mean, marks per stufdent, using assumed-mean method:
Marks
0-10
10-20
20-30
30-40
40-50
50-60
Number of students
12
18
27
20
17
6
Answer
We have, Let A = 25 be the assumed mean
Marks
Frequency$ f_i$
Mid-value $x_1$
Deviation $d_i = (x_i- 25)$
$f_1 \times d_1$
0-10
12
5
-20
-240
10-20
58
15
-10
-180
20-30
27
25 = A
0
0
30-40
20
35
10
200
40-50
17
45
20
340
50-60
6
55
30
180
Total
$\sum\text{f}_\text{i}=100$
 
 
$\sum\text{f}_\text{i}\times\text{d}_\text{i}=300$
$\bar{\text{x}}=\text{A}+\frac{\sum(\text{f}_\text{i}\times\text{x}_\text{i})}{\sum\text{f}_\text{i}}=\Big(25+\frac{300}{100}\Big)=(25+3)$Hence mean = 28
View full question & answer
Question 265 Marks
The following table shows the daily wages of workers in a factory:
Daily wages (in Rs). 0-100 100-200 200-300 300-400 400-500
Number of workers. 40 32 48 22 8
Find the median daily wage income of the workers.
Answer
Class
Frequency (f)
Cumulative Frequency
1-100
40
40
100-200
32
72
200-300
48
120
300-400
22
142
400-500
8
150
 
$\text{N}=\sum\text{f}=150$
 
$\text{N}=50$
$\Rightarrow\frac{\text{N}}{2}=75$
The cumulative frequency just greater than 75 is 120 and the corresponding class is 200-300
$\therefore\text{l}=200,\ \text{h}=100,\ \text{f}=48,\ \text{cf}=$ c.f. of preceding class = 72 and $\frac{\text{N}}{2}=75$
$\therefore$ Median $\text{M}=\text{l}+\frac{\frac{\text{N}}{2}-\text{c.f}}{\text{f}}\times\text{h}$
$=200+\Big\{100\times\frac{(75-72)}{48}\Big\}$
$=200+6.25$
$=206.25$
Hence, the median daily wage income of the workers is Rs. 206.25.
View full question & answer
Question 275 Marks
The mean of the following data is 42, find the missing frequencies x and y if the sum of the frequencies is 100.
Class interval 0-10 10-20 20-30 30-40 40-50 50-60 60-70 70-80
Frequency 7 10 x 13 y 10 14 9
Answer
We have,
Class interval Frequency $f_i$ Mid-value $x_i$ $f_i \times x_i$
0-10 7 5 35
10-20 10 15 150
20-30 x 25 25x
30-40 13 35 455
40-50 y 45 45y
50-60 10 55 550
60-70 14 65 910
70-80 9 75 675
Total $\sum\text{f}_\text{i}=63+\text{x}+\text{y}=100$   $\sum\text{f}_\text{i}\text{x}_\text{i}=2775+25\text{x}+45\text{y}$
Now, mean $=\frac{\sum\text{f}_\text{i}\text{x}_\text{i}}{\sum\text{f}_\text{i}}$ $\Rightarrow42=\frac{2775+25\text{x}}{100}$ $\Rightarrow4200=2775+25\text{x}+45\text{y}$ $\Rightarrow25\text{x}+45\text{y}=1425$ $\Rightarrow5\text{x}+9\text{y}=285\ ...(\text{i})$ Also, $63+\text{x}+\text{y}=100$$\Rightarrow\text{x}+\text{y}=37$
$\Rightarrow\text{x}=37=\text{y}$
Substituting in (i), we have$5(37-\text{y})+9\text{y}=285$
$\Rightarrow185-5\text{y}+9\text{y}=285$
$\Rightarrow4\text{y}=100$
$\Rightarrow\text{y}=25$
$\Rightarrow\text{x}=37-\text{y}=37-25=12$
Hence, $\text{x}=12$ and $\text{y}=25$
View full question & answer
Question 285 Marks
Compute the median from the following data:
Marks
0-7
7-14
14-21
21-28
28-35
35-42
42-49
Number of students
3
4
7
11
0
16
9
Answer
Class
Frequency (f)
Cumulative Frequency
0-7
3
3
7-14
4
7
14-21
7
14
21-28
11
25
28-35
0
25
35-42
16
41
42-49
9
50
Total
$\text{N}=\sum\text{f}=50$
 
$\text{N}=50$
$\Rightarrow\frac{\text{N}}{2}=25$
The cumulative frequency just greater than 25 is 41 and the corresponding class is 35-42.
$\therefore\text{l}=35,\ \text{h}=7,\ \text{f}=16,\ \text{cf}=$ of preceding class = 25 and $\frac{\text{N}}{2}=25$
$\therefore$ Median $\text{l}+\frac{\frac{\text{N}}{2}-\text{c.f}}{\text{f}}\times\text{h}$
$=35+\Big\{7\times\frac{(25-25)}{16}\Big\}$
$=35+0$
$=35$
View full question & answer
Question 295 Marks
If the median of the following frequency distribution is 32.5, find the values of $f_1$ and $f_2.$
Class interval
0-10
10-20
20-30
30-40
40-50
50-60
60-70
Total
Frequency
$f_1$
5
9
12
$f_2​​​​​​​$​​​​​​​
3
2
40
Answer
Class
frequency (f)
Cumulative frequency
0-10
$f_1$
$f_1$
10-20
5
$f_1 + 5$
20-30
9
$f_1 + 14$
30-40
12
$f_1 + 26$
40-50
$f_2$​​​​​​​
$f_1+ f_2 + 26$
50-60
3
$f_1+ f_2 + 29$
60-70
2
$f_1+ f_2 + 31$
 
$\text{N}=\sum\text{f}=40$
 
Now,$ f_1+ f_2 + 31 = 40$
$\Rightarrow f_1+ f_2 = 9$
$\Rightarrow f_2 =9 - f_1 .....(i)$
The median is 32.5 which lies in 30-40.
Hence, median class = 30-40
Here $\text{l}=30,\ \frac{\text{N}}{2}=\frac{40}{2}=20,\ \text{f}=12$ and $\text{c.f}=14+\text{f}_1$
Now, median = 32.5
$\Rightarrow\text{l}+\frac{\frac{\text{N}}{2}-\text{c.f}}{\text{f}}\times\text{h}=32.5$
$\Rightarrow30+\frac{20-(14+\text{f}_1)}{12}\times10=32.5$
$\Rightarrow\frac{6-\text{f}_1}{12}\times10=2.5$
$\Rightarrow\frac{60-10\text{f}_1}{12}=2.5$
$\Rightarrow60-10\text{f}_1=30$
$\Rightarrow10\text{f}_1=30$
$\Rightarrow\text{f}_1=3$
From equation (i), we have
$\text{f}_2=9-3$
$\Rightarrow\text{f}_2=6$
View full question & answer
Question 305 Marks
The median of the following data is 16. Find the missing frequencies a and b if the total of frequencies is 70.
Class
0-5
5-10
10-15
15-20
20-25
25-30
30-35
35-40
Frequency
12
a
12
15
b
6
6
4
Answer
Class
Frequency (f)
Cumulative Frequency
0-5
12
12
5-10
a
12 + a
10-15
12
24 + a
15-20
15
39 + a
20-25
b
39 + a + b
25-30
6
45 + a + b
30-35
6
51 + a + b
35-40
4
55 + a + b
Total
$\text{N}=\sum\text{f}_\text{i}=70$
 
Let a and b be the missing frequencies of class intervals 5-10 and 20-25 respectively. Then,
55 + a + b = 70 = a + b = 15 ...(1)
Median is 16, which lies in 15-20. So, the median class is 15-20.
$\therefore\text{l}=145,\ \text{h}=5,\ \text{f}=15$ and $\text{cf}=24+\text{a}$
Now,
Median $=\text{l}+\bigg(\frac{\frac{\text{N}}{2}-\text{cf}}{\text{f}}\bigg)\times\text{h}$
$\Rightarrow16=15+\bigg(\frac{\frac{70}{2}-(224+\text{a})}{15}\bigg)\times5$
$\Rightarrow16=15+\Big(\frac{35-24-\text{a}}{3}\Big)$
$\Rightarrow16=15\Big(\frac{11-\text{a}}{3}\Big)$
$\Rightarrow16-15=\frac{11-\text{a}}{3}$
$\Rightarrow1\times3=11-\text{a}$
$\Rightarrow\text{a}=11-\text{3}$
$\Rightarrow\text{a}=8$
$\therefore\text{b}=15-\text{a}$ [From (1)]
$\Rightarrow\text{b}=15-8$
$\Rightarrow\text{b}=7$
Hence, a= 8 and b= 7.
View full question & answer
Question 315 Marks
Find the median from the following data:
Marks
No. of students
Below 10
12
Below 20
32
Below 30
57
Below 40
80
Below 50
92
Below 60
116
Below 70
164
Below 80
200
Answer
Converting the given data into exclusive form, we get:
Class
Cumulative frequency
frequency (f)
0-10
12
12
10-20
32
20
20-30
57
25
30-40
80
23
40-50
92
12
50-60
116
24
60-70
164
48
70-80
200
36
 
 
$\text{N}=\sum\text{f}=200$
$\text{N}=200$
$\Rightarrow\frac{\text{N}}{2}=100$
The cumulative frequency just greater than 100 is 100 and the corresponding class is 50-60
Thus, the median class is 50-60.
Now, $\text{l}=50,\ \text{h}=10,\ \text{f}=24,\ \text{cf}=$ c.f. of preceding class= 92 and $\frac{\text{N}}{2}=100$
$\therefore$ Median, $\text{M}=\text{l}+\Bigg\{\text{h}\times\frac{\Big(\frac{\text{N}}{2}-\text{cf}\Big)}{\text{f}}\Bigg\}$
$=50+\Big\{10\times\frac{(100-92)}{24}\Big\}$
$=50+3.33$
$=53.33$
Hence, median wages = Rs. 53.33
View full question & answer
Question 325 Marks
Compute the mode from the following data:
Class interval
1-5
6-10
11-15
16-20
21-25
26-30
31-35
36-40
41-45
46-50
Frequency
3
8
13
18
28
20
13
8
6
4
Answer
Clearly, we have to find the mode of the data. The given data is an inclusive series. So, we will convert it to an exclusive form as given below:
Class interval 0.5-5.5 5.5-10.5 10.5-15.5 15.5-20.5 20.5-25.5 25.5-30.5 30.5-35.5 35.5-40.5 40.5-45.5 45.5-50.5
Frequency 3 8 13 18 28 20 13 8 6 4
As the class 20.5-25.5 has the maximum frequency, it is the modal class.
Now, $\text{x}_\text{k}=20.5,\ \text{h}=5,\ \text{f}_\text{k}=28,\ \text{f}_{\text{k}-1}=18,\ \text{f}_{\text{k}+1}=20$
$\therefore$ Mode, $\text{M}_0=\text{x}_\text{k}+\Big\{\text{h}\times\frac{(\text{f}_\text{k}-\text{f}_\text{k}-1)}{(2\text{f}_\text{k}-\text{f}_{\text{k}-1}-\text{f}_{\text{k}+1})}\Big\}$
$=20.5+\Big\{5\times\frac{(28-18)}{2\times28-18-20}\Big\}$
$=20.5+\Big\{5\times\frac{10}{18}\Big\}$
$=(20.5+2.78)$
$=23.28$
Hence, mode = Rs. 23.28
View full question & answer
Question 335 Marks
If the mean of the following frequency distribution is 24, find the value of p.
Class
0-10
10-20
20-30
30-40
40−50
Frequency
3
4
p
3
2
Answer
We have,
Class
Frequency $f_i$
Mid-value $x_i$
$f_i \times x_i$
0-10
3
5
15
10-20
4
15
60
20-30
p
25
25p
30-40
3
35
105
40-50
2
45
90
Total
$\sum\text{f}_\text{i}=12+\text{p}$
 
$\sum\text{f}_\text{i}\text{x}_\text{i}=270+25\text{p}$
Now, mean $=\frac{\sum\text{f}_\text{i}\text{x}_\text{i}}{\sum\text{f}_\text{i}}$
$\Rightarrow24=\frac{270+25\text{p}}{12+\text{p}}$
$\Rightarrow24(12+\text{p})=270+25\text{p}$
$\Rightarrow288+24\text{p}=270+25\text{p}$
$\Rightarrow\text{p}=18$
View full question & answer
Question 345 Marks
From the following frequency distribution, prepare the 'More Then Ogive'.
Score
Number of candidates
400-450
20
450-500
35
500-550
40
550-600
32
600-650
24
650-700
27
700-750
18
750-800
24
Total
230
Also find the median.
Answer
From the given table, we may prepare the 'more than' frequency table as shown below:
Score
Number of candidates
More than 750
34
More than 700
52
More than 650
79
More than 600
103
More than 550
135
More than 500
175
More than 450
210
More than 400
2
​​​​We plot the points A(750, 34), B(700, 52), C(650, 79), D(600, 103), E(550, 135),
F(500, 175), G(450, 210) and H(400, 230).
Join AB, BC, CD, DE, EF, FG, GH and HA with a free hand to get the curve representing the ‘more than type’ series.
Here, N = 230 $\Rightarrow\frac{\text{N}}{2}=115$ From P(0, 115), draw PQ meeting the curve at Q. Draw QM meeting at M. Clearly, OM = 590 units Hence, median = 590 units
View full question & answer
Question 355 Marks
Compute the mode from the following data:
Age (in years)
0-5
5-10
10-15
15-20
20-25
25-30
30-35
Number of patients
6
11
18
24
17
13
5
Answer
As the class 15-20 has the maximum frequency, it is the modal class.
Now, $\text{x}_\text{k}=15,\ \text{h}=5,\ \text{f}_\text{k}=24,\ \text{f}_{\text{k}-1}=18,\ \text{f}_{\text{k}+1}=17$
$\therefore$ Mode, $\text{M}_0=\text{x}_\text{k}+\Big\{\text{h}\times\frac{(\text{f}_\text{k}-\text{f}_\text{k}-1)}{(2\text{f}_\text{k}-\text{f}_{\text{k}-1}-\text{f}_{\text{k}+1})}\Big\}$
$=15+\Big\{5\times\frac{(24-18)}{2\times24-18-17}\Big\}$
$=15+\Big\{5\times\frac{6}{13}\Big\}$
$=(15+2.3)$
$=17.3$
Hence, mode = Rs. 17.3 years
View full question & answer
Question 365 Marks
Compute the mode from the following series:
Size
45-55
55-65
65-75
75-85
85-95
95-105
105-115
Frequency
7
12
17
30
32
6
10
Answer
As the class 85-95 has the maximum frequency, it is the modal class.
Now, $\text{x}_\text{k}=85,\ \text{h}=10,\ \text{f}_\text{k}=32,\ \text{f}_{\text{k}-1}=30,\ \text{f}_{\text{k}+1}=6$
$\therefore$ Mode, $\text{M}_0=\text{x}_\text{k}+\Big\{\text{h}\times\frac{(\text{f}_\text{k}-\text{f}_\text{k}-1)}{(2\text{f}_\text{k}-\text{f}_{\text{k}-1}-\text{f}_{\text{k}+1})}\Big\}$
$=85+\Big\{10\times\frac{(32-30)}{2\times32-30-6}\Big\}$
$=85+\Big\{10\times\frac{2}{28}\Big\}$
$=(85+71)$
$=85.71$
Hence, mode = Rs. 85.71
View full question & answer
Question 375 Marks
Find the mean, mode and median of the following data:
Class
0-20
20-40
40-60
60-80
80-100
100-120
120-140
Frequency
6
8
10
12
6
5
3
Answer
To find the mean let us put the data in the table given below:
Class
Frequency ($f_i$)
Class mark ($x_i​​​​​​​$)
$f_ix_i$
0−20
6
10
60
20−40
8
30
240
40−60
10
50
500
60−80
12
70
840
80−100
6
90
540
100−120
5
110
550
120−140
3
130
390
Total
$\sum\text{f}_\text{i}=50$
 
$\sum\text{f}_\text{i}\text{x}_\text{i}=3120$
Mean $=\frac{\sum_\limits{\text{i}}\text{f}_\text{i}\text{x}_\text{i}}{\sum_\limits\text{i}\text{f}_\text{i}}$
$=\frac{3120}{50}$ $=62.4$ Thus. mean of the given data is 62.4. Now, to find the median let us put the data in the table given below:
Class
Frequency ($f_i​​​​​​​$​​​​​​​)
Cumulative frequency (cf)
0−20
6
6
20−40
8
14
40−60
10
24
60−80
12
36
80−100
6
42
100−120
5
47
120−140
3
50
Total
$\sum\text{f}_\text{i}=50$
 
Now, $\text{N}=50\Rightarrow\frac{\text{N}}{2}=25.$ The cumulative frequency just greater than 25 is 36, and the corresponding class is 60-80.

Thus, the median class is 60-80 $\therefore\text{l}=60,\ \text{h}=20,\ \text{N}=50,\ \text{f}=12$ and $\text{cf}=24.$ Now, Median $=\text{l}+\bigg(\frac{\frac{\text{N}}{2}-\text{cf}}{\text{f}}\bigg)\times\text{h}$ $=40+\Big(\frac{25-24}{12}\Big)\times20$ $=60+1.67$ $=61.67$ Thus, the median is 61.67 We know that, Mode = 3(median) - 2(mean) = 3 × 61.67 - 2 × 62.4 = 185.01 - 124.8= 60.21
Hence, Mean = 62.4, Median = 61.67 and Mode = 60.21.
View full question & answer
Question 385 Marks
Find the mean of the following data, using assumed-mean method:
Class
0-20
20-40
40-60
60-80
80-100
100-120
Frequency
20
35
52
44
38
31
Answer
Let A = 50 be the assumed mean, we have
Marks
Frequency $f_i$
Mid-value $x_1$
Deviation $d_i = x_i- 150$
$f_1 \times d_1$
0-20
20
10
-40
-800
20-40
35
20
-20
-700
40-60
52
50 = A
0
0
60-80
44
70
20
880
80-100
5
90
40
1520
100-120 31 110 60 1860
 
$\sum\text{f}_\text{i}=220$
 
 
$\sum\text{f}_\text{i}\times\text{d}_\text{i}=2760$
$\bar{\text{x}}=\text{A}+\frac{\sum(\text{f}_\text{i}\times\text{x}_\text{i})}{\sum\text{f}_\text{i}}$
$=50+\frac{2760}{220}$
$=50+12.55$
$=62.55$
View full question & answer
Question 395 Marks
The following table gives the literacy rate (in percentage) in 40 cities. Find the mean literacy rate, choosing a suitable method.
Literacy rate (%)
45-55
55-65
65-75
75-85
85-95
Number of cities
4
11
12
9
4
Answer
We have,
Class interval
Frequency $f_i$
Mid-value $x_i$
$f_i \times x_i$
45-55
4
50
200
55-65
11
60
660
65-75
12
70
840
75-85
9
80
720
85-95
4
90
360
 
$\sum\text{f}_\text{i}=40$
 
$\sum\text{f}_\text{i}\text{x}_\text{i}=2780$
Now, mean $=\frac{\sum(\text{f}_\text{i}\times\text{x}_\text{i})}{\sum\text{f}_\text{i}}=\frac{2780}{40}=69.5$
Thus, the mean literacy rate is 69.5%
View full question & answer
Question 405 Marks
Calculate the missing frequency from the following distribution, it being given that the median of the distribution is 24.
Class 0-10 10-20 20-30 30-40 40-50
Frequency 5 25 ? 18 7
Answer
Class
Frequency (f)
Cumulative Frequency
0-10
5
5
10-20
25
30
20-30
x
x + 30
30-40
18
x + 48
40-50
7
x + 55
Median is 24 which lies in 20-30
$\therefore$ Median Class = 20-30
Here, $\text{l}=20,\ \frac{\text{n}}{2}=\frac{\text{x}+55}{2},$ c. f of the preceding class $\text{c.f}=30,\ \text{f}=\text{x},\ \text{h}=10$
$\therefore$ Median $\text{l}+\frac{\frac{\text{n}}{2}-\text{c.f}}{\text{f}}\times\text{h}$
$\Rightarrow24=20+\frac{\frac{\text{x}+55}{2}-30}{\text{x}}\times\text{10}$
$\Rightarrow24=20+\frac{\frac{\text{x}+55-60}{2}}{\text{x}}\times10$
$\Rightarrow24=20+\frac{\text{x}-5}{2\text{x}}\times10$
$\Rightarrow24=20+\frac{5\text{x}-25}{\text{x}}$
$\Rightarrow24=\frac{20\text{x}+5\text{x}-25}{\text{x}}$
$\Rightarrow24\text{x}=25\text{x}=25$
$\Rightarrow-\text{x}=-25$
$\Rightarrow\text{x}=25$
Hence, the unknown frequency is 25
View full question & answer
Question 415 Marks
The monthly consumption of electricity (in units) of some families of a locality is given in the following frequency distribution:
Monthly consumption (in units) 140-160 160-180 180-200 200-220 220-240 240-260 260-280
Number of families 3 8 15 40 50 30 10
Prepare a 'more than type' ogive for the following frequency distribution.
Answer
The frequency distribution table of more than type is as follows:
Height (in cm) (lower class limits)
Cumulative frequency (cf)
More than 140
3 + 153 = 156
More than 160
8 + 145 = 153
More than 180
15 + 130 = 145
More than 200
40 + 90 = 130
More than 220
50 + 40 = 90
More than 240
30 + 10 = 40
More than 260
10
Taking the lower class limits on x-axis and their respective cumulative frequencies on y-axis, its ogive can be obtained as follows:
View full question & answer
Question 425 Marks
The height of 50 girls of class X of a school are recorded as follows:
Height (in cm)
135-140
140-145
145-150
150-155
155-160
160-165
Number of girls
5
8
9
12
14
2
Draw a 'more than type' ogive for the above data.
Answer
The frequency distribution table of more than type is as follows:
Height (in cm) (lower class limits) Cumulative frequency (cf)
More than 135 5 + 45 = 50
More than 140 8 + 37 = 45
More than 145 9 + 28 = 37
More than 150 12 + 16 = 28
More than 155 14 + 2 = 16
More than 160 2
Taking the lower class limits on x-axis and their respective cumulative frequencies on y-axis, its ogive can be obtained as follows:
View full question & answer
Question 435 Marks
The following table gives the daily income of 50 workers of a factory:
Daily income (in Rs) 100-120 120-140 140-160 160-180 180-200
Number of workers 12 14 8 6 10
Find the mean, mode and median of the above data.
Answer
We have the following:
Daily income Mid value $(x_i)$ Frequency
$(f_i)$
Cumulative frequency $f_i \times x_i$
100-120 110 12 12 1320
120-140 130 14 26 1820
140-160 150 8 34 1200
160-180 170 6 40 1020
180-200 190 10 50 1900
    $\sum\text{f}_\text{i}=50$   $\sum\text{f}_\text{i}\text{x}_\text{i}=7260$
Mean $\bar{\text{x}}=\frac{\sum(\text{f}_\text{i}\times\text{x}_\text{i})}{\sum\text{f}_\text{i}}$
$=\frac{7260}{50}$
$=145.2$
Now, $\text{N}=50$
$\Rightarrow\frac{\text{N}}{2}=25$
The cumulative frequency just greater than 25 is 26 and the corresponding class is 120-140.
Thus, the median class is 120-140
Now, $\therefore\text{l}=120,\ \text{h}=20,\ \text{f}=40,\ \text{c}=$ cf of preceding class = 12 and $\frac{\text{N}}{2}=25$
Median $=\text{l}+\bigg(\frac{\frac{\text{N}}{2}-\text{cf}}{\text{f}}\bigg)\times\text{h}$
$=120+\Big\{20\times\frac{(25-12)}{14}\Big\}$
$=\Big(120+20\times\frac{13}{14}\Big)$
$=138.57$
Mode = 3(median) − 2(mean)
$=3\times138.57-2\times145.2$
$=125.31$
View full question & answer
Question 445 Marks
The frequency distribution table of more than type is as follows:
Production yield (kg/ha) (lower class limits) Cumulative frequency (cf)
More than 50 2 + 98 = 100
More than 55 8 + 90 = 98
More than 60 12 + 78 = 90
More than 65 24 + 54 = 78
More than 70 38 + 16 = 54
More than 75 16
Taking the lower class limits on x-axis and their respective cumulative frequencies on y-axis, its ogive can be obtained as follows:
Answer
​​The frequency distribution table of less than type is as follows:
Weekly expenditure (in Rs.) (upper class limits) Cumulative frequency (cf)
Less than 200 5
Less than 300 5 + 6 = 11
Less than 400 11 + 11 = 22
Less than 500 22 + 13 = 35
Less than 600 35 + 5 = 40
Less than 700 40 + 4 = 44
Less than 800 44 + 3 = 47
Less than 900 47 + 2 = 49
Taking the lower class limits on x-axis and their respective cumulative frequencies on y-axis, its ogive can be obtained as follows:
Now, The frequency distribution table of more than type is as follows:
Weekly expenditure (in Rs.) (lower class limits) Cumulative frequency (cf)
More than 100 44 + 5 = 49
More than 200 38 + 6 = 44
More than 300 27 + 11 = 38
More than 400 14 + 13 = 27
More than 500 9 + 5 = 14
More than 600 5 + 4 = 9
More than 700 2 + 3 = 5
More than 800 2
Taking the lower class limits on x-axis and their respective cumulative frequencies on y-axis, its ogive can be obtained as follows:
View full question & answer
Question 455 Marks
The following table gives the production yield per hectare of wheat of 100 farms of a village.
Production yield (kg/ha)
50-55
55-60
60-65
65-70
70-75
75-80
Number of farms
2
8
12
24
38
16
Change the distribution to a 'more than type' distribution and draw its ogive. Using ogive, find the median of the given data.
Answer
The frequency distribution table of more than type is as follows:
Production yield (kg/ha) (lower class limits) Cumulative frequency (cf)
More than 50 2 + 98 = 100
More than 55 8 + 90 = 98
More than 60 12 + 78 = 90
More than 65 24 + 54 = 78
More than 70 38 + 16 = 54
More than 75 16
Taking the lower class limits on x-axis and their respective cumulative frequencies on y-axis, its ogive can be obtained as follows:
Here, $\text{N}=100\Rightarrow\frac{\text{N}}{2}=50.$ Mark the point A whose ordinate is 50 and its x-coordinate is 70.5. 
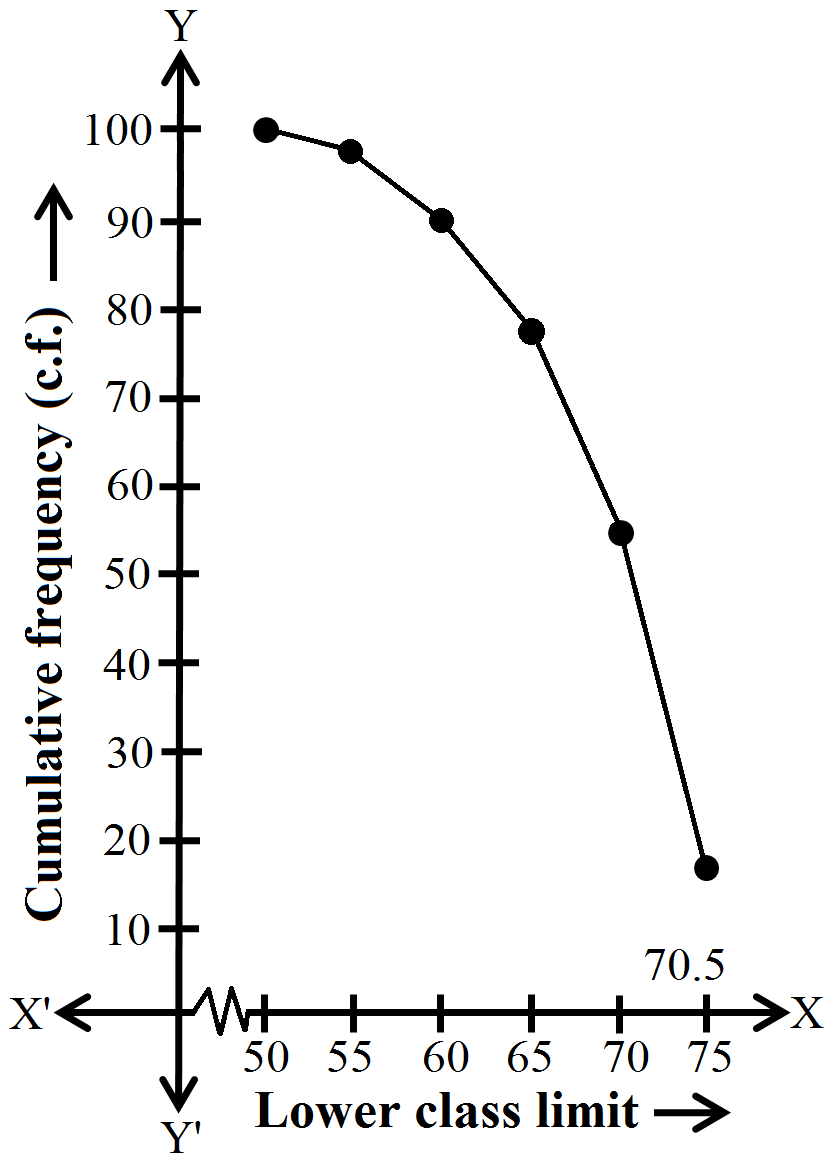
Thus, median of the data is 70.5.
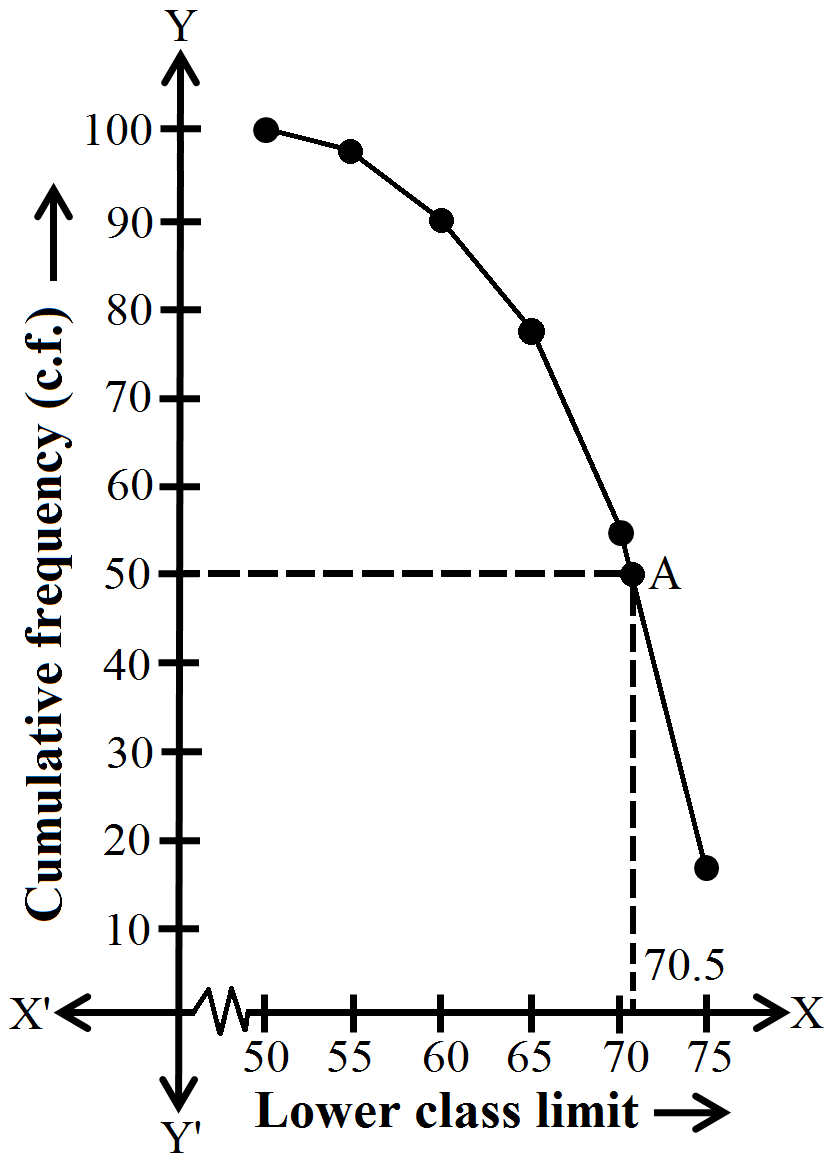
View full question & answer
Question 465 Marks
​The weights of tea in 70 packets are shown in the following table:
Weight (in grams)
200-201
201-202
202-203
203-204
204-05
205-206
Number of packets
13
27
18
10
1
1
Find the mean weight of packets using step-deviation method.
Answer
Class interval
Frequency $f_i$
Mid-value $x_i$
$\text{u}_\text{i}=\frac{\text{x}_\text{i}-\text{A}}{\text{h}}=\frac{\text{x}_\text{i}-203.5}{1}$
$f_i \times u_i$
5-15
13 200.5 -3
-39
15-25
27
201.5 -2
-54
25-35
18
202.5 -1 -18
35-45
10 203.5 = A 0 0
45-55
1 204.5 1 1
55-65 1 205.5 2 2
 
$\sum\text{f}_\text{i}=70$
 
 
$\sum\text{f}_\text{i}\text{u}_\text{i}=-108$
Thus, $\text{A}=203.5,\ \text{h}=1,\ \sum\text{f}_\text{i}=70$ and $\sum\text{f}_\text{i}\text{u}_\text{i}=-108$
Mean $=\text{A}+\Big\{\text{h}\times\frac{\sum\text{f}_\text{i}\text{u}_\text{i}}{\sum\text{f}_\text{i}}\Big\}$
$203.5+\Big\{1\times\frac{-108}{70}\Big\}$
$=203.5-1.54$
$=201.96$
$=40.81$
View full question & answer
Question 475 Marks
Find the mode of the following distribution:
Class interval
10-14
14-18
18-22
22-26
26-30
30-34
34-38
38-42
Frequency
8
6
11
20
25
22
10
4
Answer
As the class 26-30 has the maximum frequency, it is the modal class. Now, $\text{x}_\text{k=26},\ \text{h}=4,\ \text{f}_\text{k}=25,\ \text{f}_{\text{k}-1}=20,\ \text{f}_{\text{k}+1}=22$
$\therefore$ Mode $\text{M}_0=\text{x}_\text{k}+\Big\{\text{h}\times\frac{(\text{f}_\text{k}-\text{f}_\text{k}-1)}{(2\text{f}_\text{k}-\text{f}_{\text{k}-1}-\text{f}_{\text{k}+1})}\Big\}$
$=26+\Big\{4\times\frac{(25-20)}{2\times25-20-22}\Big\}$ $26+\Big\{4\times\frac{5}{8}\Big\}$ $=(26+2.5)$ $=28.5$Hence, the mode is 28.5
View full question & answer
Question 485 Marks
Find the mean, median and mode of the following data:
Class
0-10
10-20
20-30
30-40
40-50
50-60
60-70
Frequency
6
8
10
15
5
4
2
Answer
We prepare the following table:
Class
Frequency $f_i$
Mid-Value $x_i$
$f_i \times x_i$
Cumulative frequency
0-10
6
5
30
6
10-20
8
15
120
14
20-30
10
25
250
24
30-40
15
35
525
39
40-50
5
45
225
44
50-60
4
55
220
48
60-70
2
65
130
50
 
$\sum\text{f}_1=50$
 
$\sum\text{f}_\text{i}\text{x}_\text{i}=1500$
 
Mean $=\frac{\sum\text{f}_\text{i}\text{x}_\text{i}}{\sum\text{f}_\text{i}}=\frac{1500}{50}=30$
Median $\text{N}=50\Rightarrow\frac{\text{N}}{2}=25$
The cumulative frequency just greter than 25 is 39.
Hence,median class is 30-40.
$\therefore\text{l}=30,\ \text{h}=10,\ \text{f}=15,\ \text{cf}=$ cf of preceding class = 24
Now, median $=\text{l}+\begin{Bmatrix}\text{h}\times\frac{\Big(\frac{\text{N}}2{-\text{cf}}\Big)}{\text{f}}\end{Bmatrix}$
$=30+\Big\{10\times\frac{25-24}{15}\Big\}$
$=30+0.67=30.67$
Maximum frequency = 15
Hence, modal class is 30-40
Now, mode $=\text{x}_\text{k}+\text{h}\Big\{\frac{(\text{f}_\text{k}-\text{f}_{\text{k}-1})}{(2\text{f}_{\text{k}-1}-\text{f}_{\text{k}+1})}\Big\}$
$=30+10\Big\{\frac{15-10}{2(15)-10-5}\Big\}30+3.33$
$=33.33$
View full question & answer
Question 495 Marks
The following distribution shows the daily pocket allowance of children of a locality. If the mean pocket allowance is Rs. 18, find the missing frequency f.
Daily pocket allowance (in Rs.)
11-13
13-15
15-17
17-19
19-21
21-23
23-25
Number of children
7
6
9
13
f
5
4
Answer
We have,
Daily pocket allowance (in Rs.)
Number of children $f_i$
Mid-value $x_i$
$f_i\times x_i$
11−13
7
12
84
13−15
6
14
84
15−17
9
16
144
17−19
13
18
234
19−21
f
20
20f
21−23
5
22
110
23−25
4
24
96
Total
$\sum\text{f}_\text{i}=44=\text{f}$
 
$\sum\text{f}_\text{i}\text{x}_\text{i}=752+20\text{f}$
Now, mean $=\frac{\sum\text{f}_\text{i}\text{x}_\text{i}}{\sum\text{f}_\text{i}}$
$\Rightarrow18=\frac{752+20\text{f}}{44+\text{f}}$
$\Rightarrow18(44+\text{f})=752+20\text{f}$
$\Rightarrow792+18\text{f}=752+20\text{f}$
$\Rightarrow2\text{f}=40$
$\Rightarrow\text{f}=20$
View full question & answer
Question 505 Marks
Find the mode, median and mean for the following data:
Marks obtained
25-35
35-45
45-55
55-65
65-75
75-85
Number of students
7
31
33
17
11
1
Answer
To find the mean let us put the data in the table given below:
Marks obtained
Number of students ($f_i$)
Class mark ($x_i$)
$f_i \times x_i$
25-35
7
30
210
35-45
31
40
1240
45-55
33
50
1650
55-65
17
60
1020
65-75
11
70
770
75-85
1
80
80
Total
$\sum\text{f}_\text{i}=100$
 
$\sum\text{f}_\text{i}\text{x}_\text{i}=4970$

Mean $=\frac{\sum_\limits{\text{i}}\text{f}_\text{i}\text{x}_\text{i}}{\sum_\limits\text{i}\text{f}_\text{i}}$
$=\frac{4970}{100}$ $=49.7$ Thus. mean of the given data is 49.. Now, to find the median let us put the data in the table given below:
Class
Frequency ($f_i​​​​​​​$​​​​​​​)
Cumulative frequency (cf)
25-35
7
7
35-45
31
38
45-55
33
71
55-65
17
88
65-75
11
99
75-85
1
100
Total
$\text{N}=\sum\text{f}_\text{i}=100$
 
Now, $\text{N}=100\Rightarrow\frac{\text{N}}{2}=50.$The cumulative frequency just greater than 50 is 71 and the corresponding class is 45-55.
Thus, the median class is 45-55. $\therefore\text{l}=45,\ \text{h}=10,\ \text{N}=100,\ \text{f}=33$ and $\text{cf}=38.$ Now, Median $=\text{l}+\bigg(\frac{\frac{\text{N}}{2}-\text{cf}}{\text{f}}\bigg)\times\text{h}$ $=45+\Big(\frac{50-38}{33}\Big)\times10$ $=45+3.64$ $=48.64$ Thus, the median is 48.64. Mode = 3(median) - 2(mean) = 3 × 48.64 - 2 × 49.70 = 145.92 - 99.4 = 46.52 Hence, Mean = 49.70, Median = 48.64 and Mode = 46.52
View full question & answer
5 Marks Questions - Maths STD 10 Questions - Vidyadip