The mean and median of a distribution are $14$ and $15$ respectively. The value of mode is :
- A$16$
- ✓$17$
- C$18$
- D$13$
Answer: B.
View full solution →295 questions across 8 question groups — pick any mix to generate a Maths paper with step-by-step answer keys.
M.C.Q (1 Marks)
208 Q→02Assertion (A) & Reason (B) MCQ
17 Q→03Fill In The Blanks[1 Marks ]
3 Q→041 Marks Question
30 Q→052 Marks Questions
5 Q→063 Marks Question
14 Q→075 Marks Questions
13 Q→08Case study (4 Marks)
5 Q→One sample from each question group in this chapter. Select any group above to see the full set with answer keys.
Answer: B.
View full solution →Answer: C.
View full solution →Answer: A.
View full solution →Answer: A.
View full solution →Answer: B.
View full solution →| Class interval | $3-6$ | $6-9$ | $9-12$ | $12-15$ | $15-18$ | $18-21$ |
| Frequency | $2$ | $5$ | $21$ | $23$ | $10$ | $12$ |
Answer: B.
View full solution →Answer: C.
View full solution →Answer: C.
View full solution →| Class interval | $10-15$ | $15-20$ | $20-25$ | $25-30$ | $30-35$ |
| Frequency | $5$ | $9$ | $12$ | $6$ | $8$ |
Answer: D.
View full solution →| Class interval | $0-4$ | $4-8$ | $8-12$ | $12-16$ | $16-20$ |
| Frequency | $6$ | $3$ | $5$ | $20$ | $10$ |
Answer: C.
View full solution →| Classes | Frequency |
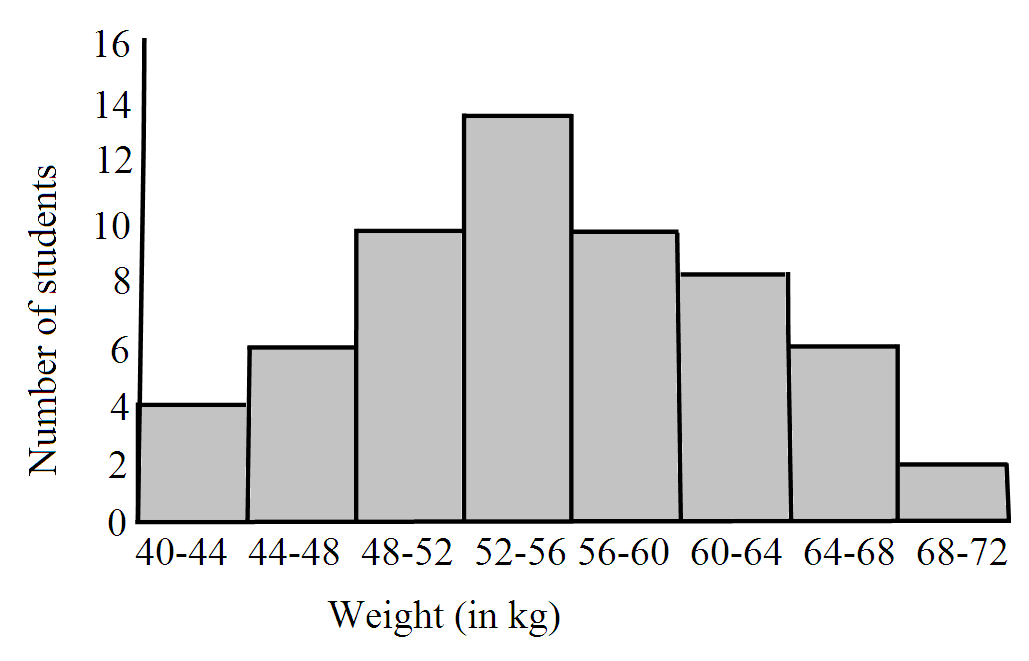
| 0 - 10 | 4 |
| 10 - 20 | 4 |
| 20 - 30 | 8 |
| 30 - 40 | 10 |
| 40 - 50 | 12 |
| 50 - 60 | 8 |
| 60 - 70 | 4 |
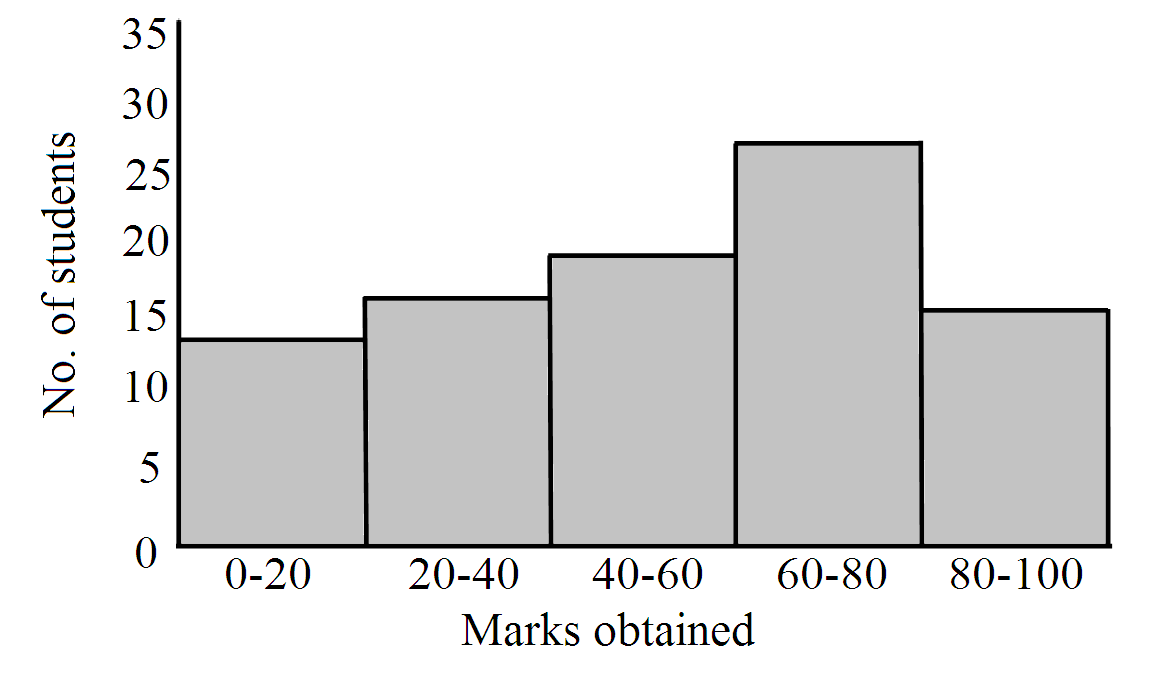
| Marks obtained | 0 - 10 | 10 - 20 | 20 - 30 | 30 - 40 | 40 - 50 | 50 - 60 |
| Frequency | 8 | 10 | 12 | 22 | 30 | 18 |
| Family size | 1-3 | 3-5 | 5-7 | 7-9 | 9-11 |
| Number of families | 7 | 8 | 2 | 2 | 1 |
| Number of Wickets | 20-60 | 60-100 | 100-150 | 150-250 | 250-350 | 350-450 |
| Number of Bowlers | 7 | 5 | 16 | 12 | 2 | 3 |
| Percentage of female teachers | 15 - 25 | 25 - 35 | 35 - 45 | 45 - 55 | 55 - 65 | 65 - 75 | 75 - 85 |
| Number of states/U.T. | 6 | 11 | 7 | 4 | 4 | 2 | 1 |
| Marks obtained $(x_i)$ | 10 | 20 | 36 | 40 | 50 | 56 | 60 | 70 | 72 | 80 | 88 | 92 | 95 |
| Number of Students $(f_i)$ | 1 | 1 | 3 | 4 | 3 | 2 | 4 | 4 | 1 | 1 | 2 | 3 | 1 |
| Number of cars | 0-10 | 10-20 | 20-30 | 30-40 | 40-50 | 50-60 | 60-70 | 70-80 |
| Frequency | 7 | 14 | 13 | 12 | 20 | 11 | 15 | 8 |
| Runs scored | Number of batsmen |
| 3000-4000 | 4 |
| 4000-5000 | 18 |
| 5000-6000 | 9 |
| 6000-7000 | 7 |
| 7000-8000 | 6 |
| 8000-9000 | 3 |
| 9000-10000 | 1 |
| 10000-11000 | 1 |
| Lifetimes (in hours) | 0-20 | 20-40 | 40-60 | 60-80 | 80-100 | 100-120 |
| Frequency | 10 | 35 | 52 | 61 | 38 | 29 |
| Literacy rate (in %) | 45-55 | 55-65 | 65-75 | 75-85 | 85-95 |
| Number of cities | 3 | 10 | 11 | 8 | 3 |
| Number of days | 0-6 | 6-10 | 10-14 | 14-20 | 20-28 | 28-38 | 38-40 |
| Number of students | 11 | 10 | 7 | 4 | 4 | 3 | 1 |
| Number of students per teacher | Number of states/U.T. |
| 15 - 20 | 3 |
| 20 - 25 | 8 |
| 25 - 30 | 9 |
| 30 - 35 | 10 |
| 35 - 40 | 3 |
| 40 - 45 | 0 |
| 45 - 50 | 0 |
| 50 - 55 | 2 |
| Expenditure (in ₹) | Frequency |
| 1000-1500 | 24 |
| 1500-2000 | 40 |
| 2000-2500 | 33 |
| 2500-3000 | 28 |
| 3000-3500 | 30 |
| 3500-4000 | 22 |
| 4000-4500 | 16 |
| 4500-5000 | 7 |
| Age (in years) | 5-15 | 15-25 | 25-35 | 35-45 | 45-55 | 55-65 |
| Number of patients | 6 | 11 | 21 | 23 | 14 | 5 |
| Number of mangoes | 50-52 | 53-55 | 56-58 | 59-61 | 62-64 |
| Number of boxes | 15 | 110 | 135 | 115 | 25 |
| Daily pocket allowance (in ₹) | 11-13 | 13-15 | 15-17 | 17-19 | 19-21 | 21-23 | 23-25 |
| Number of children | 7 | 6 | 9 | 13 | f | 5 | 4 |

|
Time (in sec)
|
0-10
|
10-20
|
20-30
|
30-40
|
40-50
|
|
No. of students
|
4
|
11
|
14
|
5
|
6
|
|
Marks
|
0-10
|
10-20
|
20-30
|
30-40
|
40-50
|
|
No. of Students
|
3
|
11
|
9
|
12
|
5
|

|
Toll tax (in ₹)
|
30-40 | 40-50 | 50-60 | 60-70 | 70-80 |
|
Number of vehicles
|
80 |
100
|
120
|
70
|
40
|
Pick question groups from the list above, set marks and difficulty, and export a branded PDF with step-by-step answer keys. First 3 chapters free — no signup.