Question 14 Marks
The following pie chart shows the percentage distribution of the expenditure incurred in publishing book. Study the pie-chart and answer the questions based on it.
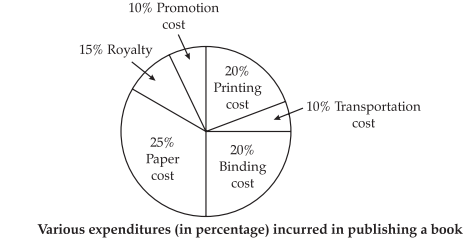
(i) If for a certain quantity of books, the publisher of pay ₹ 30,600 as printing cost, then what will be the amount of royalty to be paid for these books?
(ii) What is the central angle of the sector, corresponding to the expenditure incurred on Royalty ?
(iii) The prices of the book is marked 20% above the C.P. If the market price of the book is ₹ 180, then what is the cost of the paper used in a single copy of the book.
(iv) If 5500 copies are published and transportation cost on them amounts to ₹ 82500, then what should be the selling price of the book, so that the publisher can earn a profit of 25% ?
Answer
View full question & answer→(i) Let the amount of Royalty to be paid for these books be ₹ .
Then, 20/15 = 30600 / r
⇒r = ₹$\left(\frac{30600 \times 15}{20}\right)$ = ₹ 22950
(ii) Central angle corresponding to Royalty $=15 \%$ of $360^{\circ}$ $ =\frac{15}{100} \times 360^{\circ}=54^{\circ} $
(iii) Clearly, marked price of the book $=120 \%$ of C.P. Also, cost of paper $=25 \%$ of C.P.
let the cost of paper for a single book in ₹ n.
Then, 120 : 25 = 180 : n
⇒x= ₹$\left(\frac{125 \times 82500}{10}\right)$ = ₹ 37.50
(iv) For the publisher to earn a profit of 25% C.P.= 125% of C.P. Also, transportation cost = 10% of C.P. Let the S.P. of 5500 books be ₹ x.
Then, 10 : 125 = 82500 : x
⇒x = ₹$\left(\frac{125 \times 82500}{10}\right)$= ₹1031250>
S.P of one book = ₹ $\left(\frac{1031250}{5500}\right)$= ₹ 187.50