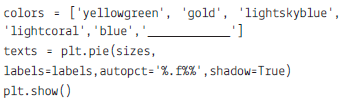
MCQ 11 MarkWhich color are available with Matplotlib:ABlueBBrown✓MagentaDTanAnswerCorrect option: C. MagentaView full question & answer→
MCQ 21 MarkWhich of the following is not used with pie diagram:AexplodeBautopctCstrangle✓NoneAnswerCorrect option: D. NoneView full question & answer→
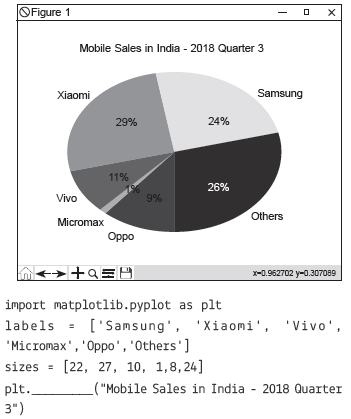
MCQ 31 MarkChoose the right answer for the given fill ups in the program: ASubplot and TitleBTitle and Blue✓Title and greenDPie and titleAnswerCorrect option: C. Title and greenView full question & answer→
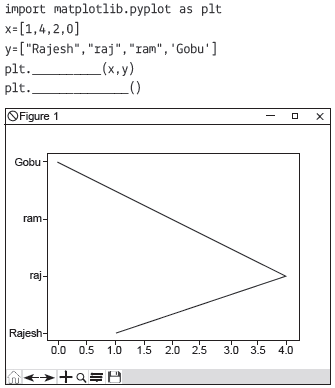
MCQ 41 MarkChoose the right answer for the given fill ups in the program:Ashow and plot✓plot and showCplot and displayDdisplay and showAnswerCorrect option: B. plot and showView full question & answer→
MCQ 51 MarkWhich type of chart we cannot make using pyplot library:ABar✓TextCSub PlotDPieAnswerCorrect option: B. TextView full question & answer→
MCQ 61 MarkWhich of the following plots are often used for checking randomness in time series?AAuto causationBAuto rank✓AutocorrelationDNone of theseAnswerCorrect option: C. AutocorrelationView full question & answer→
MCQ 71 MarkPoint out the wrong combination with regards to kind keyword for graph plotting:A'scatter' for scatter plots✓ 'kde' for hexagonal bin plotsC'pie' for pie plotsDnone of theseAnswerCorrect option: B. 'kde' for hexagonal bin plotsView full question & answer→
MCQ 81 MarkYou can create a scatter plot matrix using the $........$ method in pandas.tools.plotting.Asca_matrix✓scatter_matrixCDataFrame.plotDall of theseAnswerCorrect option: B. scatter_matrixView full question & answer→
MCQ 91 MarkWhich of the following value is provided by kind keyword for barplot?✓barhBkdeChexbinDnone of theseAnswerCorrect option: A. barhView full question & answer→
MCQ 101 MarkPoint out the correct combination with regards to kind keyword for graph plotting:A'hist' for histogramB'box' for boxplotC'area' for area plots✓all of theseAnswerCorrect option: D. all of theseView full question & answer→
MCQ 111 MarkThe plot method on Series and DataFrame is just a simple wrapper around :Agplt.plot()✓plt.plot()Cplt.plotgraph()Dnone of the aboveAnswerCorrect option: B. plt.plot()BView full question & answer→