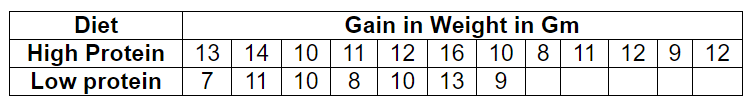
Questions

5 Marks Questions

🎯

Test yourself on this topic

4 questions · timed · auto-graded

Question 15 Marks
The heights of six randomly chosen red roses are in $cm 63,65,68,69,71$ and 72 . Those of ten randomly chosen yellow roses are $61,62,65,66,69,70,71,72$ and 73. Find $t$-statistics for the given data.
Answer

For first data set:
Number of terms in first set i.e. $n_1=6$
Calculate mean value for first data set using formula:
$\begin{aligned} \bar{x} & =\frac{\sum x}{n_1} \\ & =\frac{63+65+68+69+71+72}{6} \\ & =\frac{408}{6}=68\end{aligned}$
For second data set:
Number of terms in second set i.e. $n_2=10$
Calculate mean value for second data set using formula:
$\begin{aligned} \bar{y} & =\frac{\sum y}{n_2} \\ & =\frac{62+61+65+66+69+69+70+71+72+73}{10} \\ & =\frac{678}{10}=67.8\end{aligned}$
Construct the following table for standard error s:

Red rosesYellow Roses
x$x-\bar{x}$$(x-\bar{x})^2$y$y-\bar{y}$$(y-\bar{y})^2$
63-52561-6.846.24
65-3962-5.833.64
680065-2.87.84
691166-1.83.24
7139691.21.44
72416691.21.44
   702.24.84
   713.210.24
   724.217.64
   734.217.64
  $\sum(x-x)^2$
=60
  $\sum(y-\bar{y})^2$
=153.6

Now, compute the standard error, s using formula:
$\begin{aligned} s & =\sqrt{\frac{\sum(x-\bar{x})^2+\sum(y-\bar{y})^2}{n_1+n_2-2}} \\ s & =\sqrt{\frac{60+153.60}{6+10-2}} \\ & =\sqrt{\frac{213.60}{14}} \\ & =\sqrt{15.257} \\ & =3.906\end{aligned}$
Now using t-test formula:
$t=\frac{\bar{x}-\bar{y}}{s} \sqrt{\frac{n_1 n_2}{n_1+n_2}}$
$\begin{array}{l}=\frac{68-67.8}{3.906} \sqrt{\frac{6 \times 10}{6+10}} \\ =\frac{0.2 \sqrt{3.75}}{3.906} \\ =0.0512 \times 1.936 \\ =0.099\end{array}$
Hence, t-test value for the two data sets is 0.099.

View full question & answer
Question 25 Marks
Answer
(1) (A) 23
Number of terms in first set i.e., $n_1=9$.
Mean tillers of caged sample is
$\begin{aligned} \bar{x} & =\frac{\sum x}{n_1} \\ & =\frac{17+26+18+25+27+28+26+23+17}{9} \\ & =\frac{207}{9}=23\end{aligned}$

(2) (B) 18
Explanation: Number of terms in second set i.e., $n_2=9$.
Mean tillers of electrified sample is
$\begin{aligned} \bar{y} & =\frac{y}{n_1} \\ & =\frac{16+16+22+16+21+18+15+20}{8} \\ & =\frac{144}{8}=18\end{aligned}$

(3) (A) $s=\sqrt{\frac{\sum(x-\bar{x})^2+\sum(y-\bar{y})^2}{n_1+n_2-2}}$
Explanation: The formula for standard error is
$s=\sqrt{\frac{\sum(x-\bar{x})^2+\sum(y-\bar{y})^2}{n_1+n_2-2}}$

(4) (D) $t=\frac{\bar{x}-\bar{y}}{s} \sqrt{\frac{n_1 n_2}{n_1+n_2}}$
Explanation: The formula for two sample t-test is
$t=\frac{\bar{x}-\bar{y}}{s} \sqrt{\frac{n_1 n_2}{n_1+n_2}}$

(5) (A) The electrification does exert some effect on the tillering.
Explanation: It is given that the value of t for 15 degree of freedom at 5% level of significance is 2.131 which is less than the calculated value of t i.e., 2.751. Hence the difference between the mean tillers of the two samples is significant i.e., the electrification does exert some effect on the tillering.
View full question & answer
Question 35 Marks

Two horse A and B were tested according to the time (in seconds) to run a particular track with the following results:

Horse A28303233332934
Horse B293030242729 

Test whether you can discriminate between two horses. You can use the fact that 5% value of t for 11 degrees of freedom is 2.20.

Answer

For first data set:
Number of terms in first set i.e. $n_1=7$
Mean of $A$ is
$\begin{aligned} \bar{x} & =\frac{\sum x}{n_1} \\ & =\frac{28+30+32+33+33+29+34}{7} \\ & =\frac{219}{7} \\ & =31.29\end{aligned}$
For second data set:
Number of terms in second set i.e., $n_2=6$ Mean of $B$ is
$\begin{aligned} \bar{y} & =\frac{\sum y}{n_2} \\ & =\frac{29+30+30+24+27+29}{6} \\ & =\frac{169}{6} \\ & =28.16\end{aligned}$
Construct the following table for standard error $s$ :

Horse AHorse B
x$x-\bar{x}$$(x-\bar{x})^2$y$y-\bar{y}$$(y-\bar{y})^2$
28-3.2910.82290.840.71
30-1.291.66301.843.39
320.710.50301.843.39
331.712.9224-4.1617.31
331.712.9227-1.161.35
29-2.295.24290.840.71
342.717.34   
  $\sum(x-\bar{x})^2$
=31.4
  $\sum(y-\bar{y})^2$
=26.86

Now, compute the standard error, $s$ using formula:
$\begin{aligned} s & =\sqrt{\frac{\sum(x-\bar{x})^2+\sum(y-\bar{y})^2}{n_1+n_2-2}} \\ s & =\sqrt{\frac{31.4+26.86}{7+6-2}} \\ & =\sqrt{\frac{58.26}{11}} \\ & =\sqrt{5.29} \\ & =2.3\end{aligned}$
Now using t-test formula:
$\begin{aligned} t & =\frac{\bar{x}-\bar{y}}{s} \sqrt{\frac{n_1 n_2}{n_1+n_2}} \\ t & =\frac{31.29-28.16}{2.3} \sqrt{\frac{7 \times 6}{7+6}} \\ & =\frac{3.13}{2.3} \sqrt{3.23} \\ & =1.36 \times 1.79 \\ & =2.43\end{aligned}$
Hence, $t$-test value for the two data sets is 2.43 .
The degree of freedom $=n_1+n_2-2=7+6-2=11$
Given, the value of $t$ for 11 degrees of freedom at $5 \%$ level of significance $=2.20$, which is less than the calculated value of $t$. Hence the difference is significant i.e., we can discriminate between two horses.

View full question & answer
Question 45 Marks
Answer

For first data set:
Number of terms in first set i.e. $n_1=6$
Calculate mean value for first data set using formula:
$\begin{aligned} \bar{x} & =\frac{\sum x}{n_1} \\ & =\frac{63+65+68+69+71+72}{6} \\ & =\frac{408}{6}=68\end{aligned}$
For second data set:
Number of terms in second set i.e. $n_2=10$
Calculate mean value for second data set using formula:
$\begin{aligned} \bar{y} & =\frac{\sum y}{n_2} \\ & =\frac{62+61+65+66+69+69+70+71+72+73}{10} \\ & =\frac{678}{10}=67.8\end{aligned}$
Construct the following table for standard error s:

Red rosesYellow Roses
x$x-\bar{x}$$(x-\bar{x})^2$y$y-\bar{y}$$(y-\bar{y})^2$
63-52561-6.846.24
65-3962-5.833.64
680065-2.87.84
691166-1.83.24
7139691.21.44
72416691.21.44
   702.24.84
   713.210.24
   724.217.64
   734.217.64
  $\sum(x-x)^2$
=60
  $\sum(y-\bar{y})^2$
=153.6

Now, compute the standard error, s using formula:
$\begin{aligned} s & =\sqrt{\frac{\sum(x-\bar{x})^2+\sum(y-\bar{y})^2}{n_1+n_2-2}} \\ s & =\sqrt{\frac{60+153.60}{6+10-2}} \\ & =\sqrt{\frac{213.60}{14}} \\ & =\sqrt{15.257} \\ & =3.906\end{aligned}$
Now using t-test formula:
$t=\frac{\bar{x}-\bar{y}}{s} \sqrt{\frac{n_1 n_2}{n_1+n_2}}$
$\begin{array}{l}=\frac{68-67.8}{3.906} \sqrt{\frac{6 \times 10}{6+10}} \\ =\frac{0.2 \sqrt{3.75}}{3.906} \\ =0.0512 \times 1.936 \\ =0.099\end{array}$
Hence, t-test value for the two data sets is 0.099.

View full question & answer
5 Marks Questions - Applied Maths STD 12 Science Questions - Vidyadip