Which function is used to rename the existing column?
- ✓rename
- Bdrop
- Cpivot
- Dappend
Answer: A.
View full solution →43 questions across 6 question groups — pick any mix to generate a Computer Science paper with step-by-step answer keys.
M.C.Q
6 Q→021 Marks Each
8 Q→032 Marks Each
9 Q→043 Marks Each
9 Q→055 Marks Each
7 Q→064 Marks Each
4 Q→One sample from each question group in this chapter. Select any group above to see the full set with answer keys.
Answer: A.
View full solution →Answer: A.
View full solution →Answer: C.
View full solution →Answer: C.
View full solution →Answer: C.
View full solution →Give column headings as Item Name, Quantity, Price.
Make sure to read first row as data and not as column headers.
| City | Hospitals | Schools | |
| 0 | Delhi | 189 | 7916 |
| 1 | Mumbai | 208 | 8508 |
| 2 | Kolkata | 149 | 7226 |
| 3 | Chennai | 157 | 7617 |
(a) Choose the right statement to get the given output:
(i) Df1.mean()
(ii) Df1.mean(axis=1)
(iii) Df1.average()
(iv) Df1.median()
(b) Write the command to get the given output:
| City | Hospitals | Schools | |
| 3 | Chennai | 157 | 7617 |
| 0 | Delhi | 189 | 7916 |
| 2 | Kolkata | 149 | 7226 |
| 1 | Mumbai | 208 | 8508 |
(i) Df1.sort(by=‘City’)
(ii) Df1.sort_values(‘City’)
(iii) Df1.sort_values(by=‘City’)
(iv) Df1.sort_values(by==‘City’)
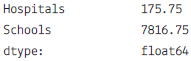
(c) Choose the right statement to get given output:
| Hospitals | Schools | |
| count | 4,000000 | 4,000000 |
| mean | 175.750000 | 7816.750000 |
| std | 27.584718 | 540.543785 |
| min | 149.000000 | 7226.000000 |
| 25% | 155.000000 | 7519.250000 |
| 50% | 173.000000 | 7766.500000 |
| 75% | 193.000000 | 8064.000000 |
| max | 208.000000 | 8508.000000 |
(i) Df1.desc()
(ii) Df1.statistics()
(iii) Df1.desctibe()
(iv) Df1.showall()
(d) Chose the right function to fill in given statement to make the city as index value:
Df1._________________(‘City’,inplace=True)
(i) Df1.set_index(‘City’,inplace=True)
(ii) Df1.index('City',inplace=True)
(iii) Df1.new_index(‘City ‘,inplace=True)
(iv) Df1.reset_index(‘City’,inplace=True)
(e) Which Pandas command is used to rename the columns & index name of the above dataframe
(i) Df1.renamecolumns()
(ii) Df1.Rename()
(iii) Df1.rename()
(iv) Df1.indexrename()
| Ecode | Name | Age | Fav_Color | Salary |
| 101 | Rohit | 20 | Blue | 45000 |
| 102 | Mohanti | 24 | Red | 36000 |
| 103 | Tushar Koul | 23 | Green | 42000 |
| 104 | Rupali | 22 | Yellow | 38000 |
| 105 | Gurpreet | 21 | Pink | 40000 |
(a) Select the command from the given options that will give the following output:-
(i) print(emp.max)
(ii) print(emp.max(axis=1))
(iii) print(emp.max,axis=1)
(iv) print(emp.max())
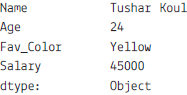
(b) A manager wants to know the Favourite colour of the employee with the employee code 103. Help him to identify the correct set of statements from the given options:
(i) df1=emp[emp[‘Ecode’]==103]
print(df1)
(ii) df1=emp['Ecode'==103]
print(df1)
(iii) df1=emp[emp.Ecode=103]
print(df1)
(iv) df1=emp[emp.Ecode==103]
print(df1)
(c) Which of the following statement will give the names of the employees whose salary is more than 40000.
(i) print(emp.max())
(ii) print(emp[emp["Salary"]>40000])
(iii) print(emp["Salary"]>40000)
(iv) print(emp.max()>40000)
(d) Which of the following command will list only the columns Ename and Salary using loc:
(i) print(emp.loc[:,[0,2]]
(ii) print(emp.loc[:,["Ename","Salary"]])
(iii) print(emp.loc(:["Ename","Salary"]))
(iv) print(emp.loc[["Ename","Salary"]])
(e) Mr. Singh, the manager wants to add a new column, the Rank with the values ‘IV’, ‘II’, ‘III’, ‘IV’, ‘I’, to the data frame Help him to identify the right command from the followings to do so :
(i) emp.column=[‘IV’, ‘II’, ‘III’, ‘IV’, ‘I’ ]
(ii) emp.iloc["Rank"] =[‘IV’, ‘II’, ‘III’, ‘IV’, ‘I’]
(iii) emp["Rank"] =[‘IV’, ‘II’, ‘III’, ‘IV’, ‘I’ ]
(iv) None of the above
Answer the following questions:
| id | Feature1 | Feature2 | |
| 0 | 1 | A | B |
| 1 | 2 | C | D |
| 2 | 3 | E | F |
| 3 | 4 | G | H |
| 4 | 5 | I | J |
| id | Feature1 | Feature2 | |
| 0 | 1 | K | L |
| 1 | 2 | M | N |
| 2 | 6 | O | P |
| 3 | 7 | Q | R |
| 4 | 8 | S | T |
(i) To create the data frame for the above dataset.
(ii) To join the data frames.
(iii) To count the the rows in new data frame.
(iv) To reset the index.
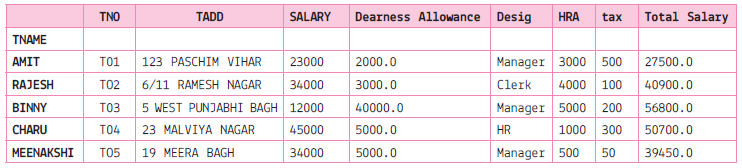
(i) To print the maximum salary of the Total Salary column.
(ii) To print the data in ascending order of Total Salary.
(iii) To print the data in descending order of Total Salary.
(iv) To print 'sum','mean','max','min','count','median','var'fro the columns 'SALARY','tax','Total Salary'.
| Account | Name | Rep | Manager | Product | Quantity | Price | Status | |
| 0 | 714466 | Tata | Saryu | Abhishek | CPU | 1 | 30000 | presented |
| 1 | 714466 | Tata | Saryu | Abhishek | Software | 1 | 10000 | presented |
| 2 | 714466 | Tata | Saryu | Abhishek | Maintenance | 2 | 5000 | pending |
| 3 | 737550 | Infosys | Saryu | Abhishek | CPU | 1 | 35000 | declined |
| 4 | 146832 | Sapient | Taneja | Abhishek | CPU | 2 | 65000 | won |
| 5 | 218895 | IBM | Taneja | Abhishek | CPU | 2 | 40000 | pending |
| 6 | 218895 | IBM | Taneja | Abhishek | Software | 1 | 10000 | presented |
| 7 | 412290 | Oracle | Joe | Abhishek | Maintenance | 2 | 5000 | pending |
| 8 | 740150 | Flipkart | Joe | Abhishek | CPU | 1 | 35000 | declined |
| 9 | 141962 | Byju | Charu | Arush | CPU | 2 | 65000 | won |
| 10 | 163416 | Gradup | Charu | Arush | CPU | 1 | 30000 | presented |
| 11 | 239344 | Funtoot | Charu | Arush | Maintenance | 1 | 5000 | pending |
| 12 | 239344 | Funtoot | Charu | Arush | Software | 1 | 10000 | presented |
| 13 | 307599 | SQL | Naveen | Arush | Maintenance | 3 | 7000 | won |
| 14 | 688981 | PiE | Naveen | Arush | CPU | 5 | 100000 | won |
| 15 | 729833 | Amazon | Naveen | Arush | CPU | 2 | 65000 | declined |
| 16 | 729833 | Amazon | Naveen | Arush | Monitor | 2 | 5000 | presented |
(i) To print the complete dataframe Name wise.
(ii) To print the dataframe Name wise, Rep waise and Manage wise.
(iii) To print the data frame Manager and Rep wise.
(iv) To print the data frame Manager and Rep price wise
(v) To print the sum of the price, manager and rep wise.
(vi) To print the mean and count of the price which belong to each manager and rep.
(vii) To print the sum of the price which belong to each manager and rep.
(viii) To print the sum of the price which belong to each manager and rep along with Product belongs to them. Fill the NaN with 0.
Answer the following question the basis of given dataframe:
| Itemno | ItemName | Color | Price | |
| 0 | 1 | Ball Pen | Black | 15.0 |
| 1 | 2 | Pencil | Blue | 5.5 |
| 2 | 3 | Ball Pen | Green | 10.5 |
| 3 | 4 | Gel Pen | Green | 11.0 |
| 4 | 5 | Notenook | Red | 15.5 |
| 5 | 6 | Ball Pen | Green | 11.5 |
| 6 | 7 | Highlighter | Blue | 8.5 |
| 7 | 8 | Gel Pen | Red | 12.5 |
| 8 | 9 | P Marker | Blue | 5.6 |
| 9 | 10 | Ball Pen | Green | 11.5 |
(i) To set the index to column Item Name.
(ii) To print the pivoting the data based on Item name as index, column as color and values as price.
(iii) To print the data as row index Itemname and columns index as color. Fill NaN as blank
(iv) To create another alias df3 and store the result of question 2.
(v) To add a new column QTY.
(vi) To print the mean priceod of all Item name and color wise.
(vii) To print the mean of the price, Item name and color margin wise.
(viii) To print the mean of the price, Item name and color wise with margins as Total.
(ix) To display the sorted data in ascending order according to the price
(x) To display the sorted data in descending order according to the price
(xi) To sort the data index wise.
(xii) To print the median.
(xiii) To print the maximum values column wise.
(xiv) To print the sum of the price.
(xv) To print the maximum of each column
(xvi) To print the first quantile of the price.
(xvii) To print the first quantile of Item no
(xviii) To print the first quartile, second quartile and third quartile. of Item no.
(xix) To print all the descriptive statistics.
| class | order | max_speed | |
| falcon | bird | Falconiformes | 389.0 |
| parrot | bird | Psittaciformes | 24.0 |
| lion | mammal | Carnivora | 80.2 |
| monkey | mammal | Primates | NaN |
| leopard | mammal | Carnivora | 58.0 |
(i) To print the class wise sum.
(ii) To print the order wise mean
(iii) To sort the index.
(iv) To print the sum of the class wise along with orders columns indexing.
(v) To count the records.
| From_To | FlightNumber | RecentDelays | Airline | |
| 0 | NewDelhi_Chennai | 10045.0 | [23, 47] | Spicejet |
| 1 | Mumbai_NewDelhi | NaN | [] | Indigo |
| 2 | Jaipur_Jammu | 10065.0 | [24, 43, 87] | Spicejet |
| 3 | Chennai_Lucknow | NaN | [13] | Indian Airlines |
| 4 | Mumnbai_Chennai | 10085.0 | [67, 32] | Spicejet |
(i) #To display the maximum flight number
(ii) #To print the number of flights airline wise
(iii) #to drop the nan values from the dataframe
(iv) To fill nan with blank values
(v) To print the maximum values of recent delays
(vi) To print the median of all the numeric values.
(vii) To print the sum of the recentdelays
(viii) To count the flight numbers.
(ix) To print the airline wise the sum of the recentdelays along with From_to as column
(x) To print the airline wise the sum of the recentdelays along with From_to as column. Also fill NaN values as blank.
| animal | age | visits | priority | |
| a | cat | 2.5 | 1 | yes |
| b | cat | 3.0 | 3 | yes |
| c | snake | 0.5 | 2 | No |
| d | dog | NaN | 3 | yes |
| e | dog | 5.0 | 2 | No |
| f | cat | 2.0 | 3 | No |
| g | snake | 4.5 | 1 | No |
| h | cat | NaN | 1 | yes |
| i | dog | 7.0 | 2 | No |
| j | dog | 3.0 | 1 | No |
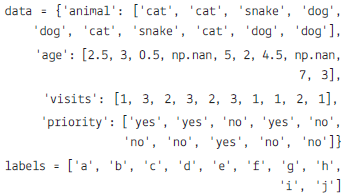
(a) To create the dataframe from the above dictionary and index is stored in label list.
(b) To display the Data frame.
(c) To calculate the sum of all visits (the total number of visits).
(d) Calculate the mean age for each different animal in df
(e) To Append a new row 'k' to df with your choice of values for each column.
(f) To delete the new entered row.
(g) To count the number of each type of animal in df.
(h) To sort df first by the values in the 'age' in descending order, then by the value in the 'visit' column in ascending order.
(i) To print the maximum values of each column.
(j) To display all the statistics.
(k) To sort the data according the index.
Pick question groups from the list above, set marks and difficulty, and export a branded PDF with step-by-step answer keys. First 3 chapters free — no signup.