Questions

5 Marks Each

🎯

Test yourself on this topic

7 questions · timed · auto-graded

Question 15 Marks
Explain law of demand with the help of schedule and diagram.
Answer
Demand schedule:
  • A demand schedule is a table that shows the willingness of a consumer to buy different quantities of a good at various prices.
  • The graphical representation of a demand schedule is called a demand curve.
Example:
The data shown in the table below is an imaginary example of a demand schedule.
Price of milk (in ₹) Demand of milk (in litres)
$50$ $1$
$40$ $2$
$30$ $3$
$20$ $4$
$10$ $5$

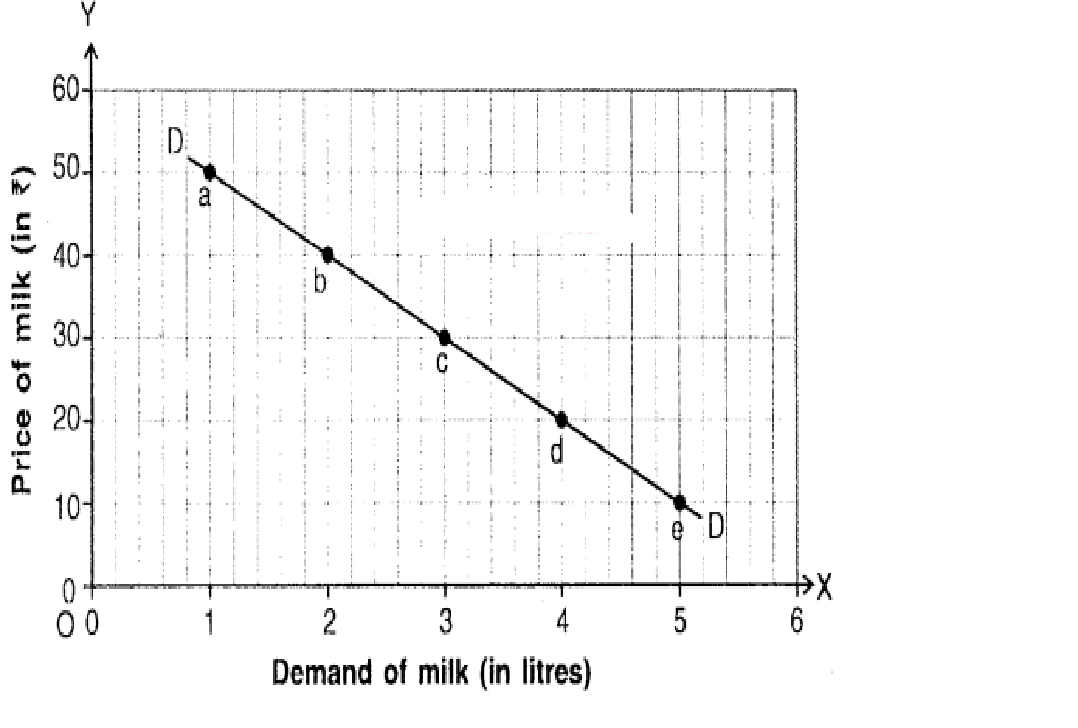
Diagram for law of demand
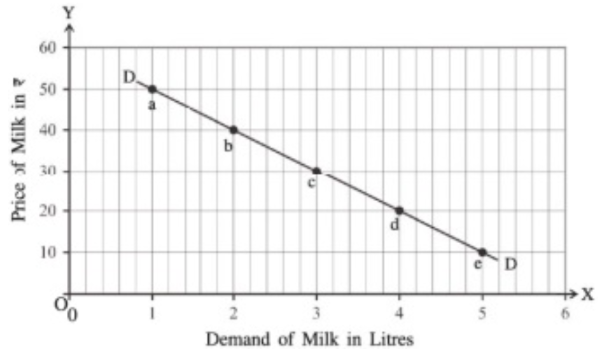
The schedule (table) shows various prices of milk and its demand at those prices.
  • The data of schedule is plotted on a graph to obtain a demand curve.
  • Price of milk which is an independent variable is taken $Y$-axis and demand for milk which is dependant on price is taken on $X$-axis.
Demand curve:
  • By plotting the demand given in the schedule at various prices, we get points $‘a’, ‘b’ ‘c’, ‘d’$ and $‘e’$. These plotted points show the various price- demand combinations.
  • On joining these points, we get the demand curve $‘DD’$. This curve slopes downward from left to right which indicates that there is an inverse relationship between price and demand.
Explanation of the demand curve:
At point $‘a’$, price of milk is $₹ 50$ and demand is $1$ litre. At point $‘b’,$ when the price falls to $₹ 40$ the demand rises to $2$ liters. Similarly, at point $‘e’$ when price falls to as low as? $10$, the demand expands to as high as $5$ liters.
Analysis/Conclusion:
  • Price and demand and inversely proportionate i.e. when price rises, demand falls and vice-versa.
  • This inverse relationship occurs because of two reasons. They are:
  1. Income effect and
  2. Substitution effect.
View full question & answer
Question 25 Marks
Define demand and explain factors affecting demand.
Answer
Demand:
The quantity of a commodity which a buyer desires, is able and willing to buy at a given price at a given point of time is called demand.Demand is defined or determined by five factors namely:
  1. Desire,
  2. Willingness to buy,
  3. Ability to buy,
  4. A particular price and
  5. A particular point of time.
All these five factors are necessary for defining demand.
The factors that determine demand i.e. determinants of demand of a commodity/service can be classified into two main parts. They are:
$(I)$ Price of commodity/service
$(II)$ Factors other than price (i.e. other determinants)
$(I)$ Price of a commodity/service:
  • Price of a good is the most important determinant of its demand.
  • When price of a good falls, a thoughtful consumer buys more and the demand expands. When price falls thoughtful consumers buys less and so demand contracts.
$(II)$ Other determinants:
$1.$ Tastes and preferences of a consumer:
  • Demand depends a lot on tastes and preferences of a consumer.
  • Tastes and preferences are associated with the likes and dislikes of a consumer as well as several other factors such as age, trends, etc.
Example:
  • If a person is fond of reading, his preference for reading will change with age.
  • At a young age, a person prefers to read story books, at adolescence he may prefer*to read novels and in old age*may prefer to read spiritual books.
$2.$ Income of a consumer:
  • The demand for a commodity increases with increase in the consumer’s income. Similarly, when his income falls, his demand for a good falls. Thus, there is a direct relationship between income and demand.
    Inferior goods:
  • Contrary to this fact, there are some goods called inferior goods on which this direct relationship does not hold true.
  • In economics, an inferior good is a good whose demand decreases when consumer’s income rises or whose demand rises when consumer’s income decreases.
Example of inferior goods/services:
For example, travelling through inter-city bus is a cheaper (inferior) mode than air or rail travel, but is more time-consuming. When a consumer has less money he prefers traveling by bus i.e. demand for bus travel is more. However, when his income rises he prefers faster and more comfortable transport system such as private car or by air i.e. demand for bus travel decreases.
$3.$ Prices of related goods:
Goods such as french-fries and ketchup that are closely related to each other are called related goods. The price of refated goods is one of the other factors affecting demand.
Related goods are classified as either
  1. Substitute goods or
  2. Complementary goods.
The demand for a particular good depends upon the price and availability of its related goods, namely, substitute goods and complementary goods. For example, If the price of french-fries gets doubled the demand for ketchup may decline.
$4.$ Expectations about future prices:
An individual’s expectation about the future price of a good affects his current demand for that good. If the consumer expects the price of a good to rise in the future, his demand for that good increases in the current time and vice-versa.
5. Size and demographic profile of population:
  • The size of population, as well as the demographic profile of the people, impacts the total market demand for a good.
  • If the population of a region is large then total market demand will be more and vice-versa. Similarly, if majority of population belongs to a particular age-group then the demand for certain goods in the market will be more.
  • For example, a Cafe will be in more demand near colleges because of high concentration of youths.
View full question & answer
Question 35 Marks
Difference between expansion-contraction and increase-decrease in demand :
Answer
No. Expansion – Contraction in Demand Increase – Decrease in Demand
$1.$ If all factors remain constant and price of commodity increases, the increase in demand is called expansion of demand. If the price of commodity increase and if demand decreases it is called contraction of demand. If the price remains constant and other factors change, if there is increase in demand. It is called increase in demand. If demand decreases, it is called decrease in demand
$2.$ Expansion and constriction of demand are caused by the change in price. All the factors are constant expect price the change in demand is caused by change in other factors.
$3.$ In expansion and contraction of demand, the movement is the same on demand curve. With expansion of demand, consumer moves from point above to point below on demand curve. When contraction of demand takes place, the movement is from downward to upward. In increase and decrease of demand, demand curve changes. New demand curves are created when there is change in demand. In demand increase new demand curve moves on right side parallel to original demand curve. If demand decreases, a new demand curve parallel to original demand moves on left side parallel to the original demand curve.
View full question & answer
Question 45 Marks
Explain the difference between increase-decrease and expansion-contraction in demand.
Answer
 
  • Introduction:
  • In any country the economic changes are occurred according to time duration.
  • Some changes are beneficial where some creates negativity in economy.
  • For making policy the study trade cycle is necessary.
  • Some economist called trade cycle as economic $($dynamic$)$ changes.
  • Meaning of Trade Cycle :
  • Different authors has given different following definitions :
  • According to Haberler, “Trade Cycle is an interval that embrace alternating periods of prosperity $($goods time$)$ and depression $($bad time$)$.”
  • According to Howtrey, “Trade Cycle are continuous phases of goods and bad changes occurring in the economy.”
  • Important phases $($stages$)$ of Trade Cycle :
  • There are mainly four phases of trade cycle:
  • Boom $($inflation or peak$)$ :
  • In this stage price and production increases.
  • The business are at top level so production and demand increase and profitability in economy also increase.
  • Producer increase production activity so capital investment and employment increase.
  • Production is seen at maximum level in the country.
  • The bank also increase the credit creation.
  • Recession $($Down-Swing$)$ :
  • At the end of the inflation there is a starting point of recession.
  • During peak time for profit purpose capital investment increases.
  • That increase the price of product but with that production expense increase.
  • Another side marginal productivity reduce at diminishing rate, so softness is seen in economy.
  • If demand reduce then it effect on new capital investment.
  • During peak time unproductive investment expenses increase but when price reduction start then in emergency production cost reduction can not be possible so it create loss situation, so production and employment also decrease.
  • Depression $($slow down in Recession/Regaining Possession$)$ :
  • This process is gradually put economy into the deep mine.
  • The reduction in demand increase supply and start reduction in price.
  • This price reduction, reduce capital investment and employment.
  • In future the assumption of price reduction also stop the demand in current market, it arise depression situation.
  • At this time duration people have purchasing power capacity but due to thinking of price reduction they are not ready to purchase the product.
  • The reduction in demand reduce capital investment and employment.
  • In this stage of depression production, employment and economic activities are at bottom level. People are in crisis.
  • Recovery $($Expansion$)$ $OR$ Regaining Possession:
  • After the last stage of depression the expansion $($recovery$)$ process is start.
  • People start gradually to purchase commodity.
  • During recession production and stock reduce but now due to scarcity, producer start production.
  • Bank reduce interest rate and employee reduce their wages.
  • That is why production expenses reduce.
  • Another side income and employment increase profitability and economy moves towards expansion path.
  • Government may try to boost investment and employment and certain times technological changes happen in the long run.
View full question & answer
Question 55 Marks
Answer the questions based on the figure provided below.
Image
(1) What is the price when the demand for milk is 1 liter?
(2) What is the demand for milk when the price is 30 rupees?
(3) What is the relationship between the demand for milk and its price?
(4) If the price is increased from 50 rupees to 40 rupees, how much will the demand for milk change?
(5) If the demand for milk is reduced from 5 liters to 3 liters, how much will the price change?
Answer
(1) It is clear from the figure that when the demand for milk is 1 liter, the price is 50 rupees.
(2) It is clear from the figure that when the price is 30 rupees, the demand for milk is 3 liters.
(3) It is clear from the figure that the relationship between the demand for milk and its price is inversely proportional. That is, when the price increases, the demand decreases, and when the price decreases, the demand increases.
(4) When the price is 50 rupees, the demand for milk is 1 liter, and when the price is 40 rupees, the demand for milk is 2 liters. This means there is an increase of 2-1 = 1 liter in the demand for milk.
(5) When the demand for milk is 5 liters, the price is 10 rupees, and when the demand for milk is 3 liters, the price is 30 rupees. This means there is an increase of $30-10=20$ rupees in price.
View full question & answer
Question 65 Marks
Answer the questions based on the figure provided below.
Image

(1) What is the demand for milk when the price is 3 rupees?
(2) What is the price of milk when the demand is $1$ liter?
(3) What is the relationship between the demand for milk and its price?
(4) If the price of milk is increased from 3 rupees to 5 rupees, how much will the demand for milk change?
(5) If the demand for milk is increased from 1 liter to 3 liters, how much will the price change?
Answer
(1) It is clear from the figure that when the price of milk is 3 rupees, the demand for milk is 3 liters.
(2) It is clear from the figure that when the demand for milk is $1$ liter, the price is 5 rupees.
(3) It is clear from the figure that the relationship between the demand for milk and its price is inversely proportional. That is, when the price increases, the demand decreases, and when the price decreases, the demand increases.
(4) When the price of milk is 3 rupees, the demand is 3 liters, and when the price is 5 rupees, the demand is 1 liter. This means there is a decrease of $3 - 1 = 2$ liters in the demand for milk. This is referred to as a contraction of demand.
(5) When the demand for milk is 1 liter, the price is 5 rupees, and when the demand for milk is 3 liters, the price is 3 rupees. This means there is a decrease of 5-3=2 rupees in price. This is referred to as an extension of demand.
View full question & answer
Question 75 Marks
Answer the questions based on the figure provided below.
Image
(1) What is the price when the demand for milk is 1 liter?
(2) What is the demand for milk when the price is 3 rupees?
(3) What is the relationship between the demand for milk and its price?
(4) If the price is increased from 5 rupees to 3 rupees, how much will the demand for milk change?
(5) If the demand for milk is reduced from 3 liters to 1 liter, how much will the price change?
Answer
(1) It is clear from the figure that when the demand for milk is 1 liter, the price is 5 rupees. (2) It is clear from the figure that when the price is 3 rupees, the demand for milk is 3 liters.
(3) It is clear from the figure that the relationship between the demand for milk and its price is inversely proportional. That is, when the price increases, the demand decreases, and when the price decreases, the demand increases.
(4) When the price is 5 rupees, the demand for milk is 1 liter, and when the price is 3 rupees, the demand for milk is 3 liters. This means there is an increase of 3-1 = 2 liters in the demand for milk. This is referred to as an extension of demand.
(5) When the demand for milk is 3 liters, the price is 3 rupees, and when the demand for milk is 1 liter, the price is 5 rupees. This means there is an increase of 5-3 = 2 rupees in price. This is referred to as a contraction of demand.
View full question & answer
5 Marks Each - Economics STD 11 Commerce Questions - Vidyadip