Question 13 Marks
Explain increase-decrease of supply along with diagram.
Answer
Increase-decrease in supply:
Assuming price as constant if the supply increase/decrease due -to some other factors, it is known as increase/ decrease in supply.
Rightward shift:
Increase and decrease of supply
Increase in supply:
View full question & answer→Increase-decrease in supply:
Assuming price as constant if the supply increase/decrease due -to some other factors, it is known as increase/ decrease in supply.
Rightward shift:
- Keeping price facto, constant, if supply increases due to any other factor, the supply curve will shift towards right which is called rightward shift in supply curve.
- The factors responsible for rightward shift could be fall in cost of production, fall in prices of factors of production, improvement in technology, rise in number of suppliers, government policies, etc.
- Keeping price factor as constant, if supply decreases due to any other factor, the supply curve will shift towards left which is called leftward shift in supply curve.
- Leftward shift takes place when one or more above mentioned factors behaves in a reversed manner.
- The schedule (table) given below contains data of price of a commodity and its various supply at that constant price.
- Note that price $₹ 20$ is constant. A supply curve is plotted for the given data.
| Price of apples (in ₹) | Supply of apples (in kg) |
| $20$ | $100$ |
| $20$ | $200$ |
| $20$ | $300$ |
| $20$ | $400$ |
| $20$ | $500$ |
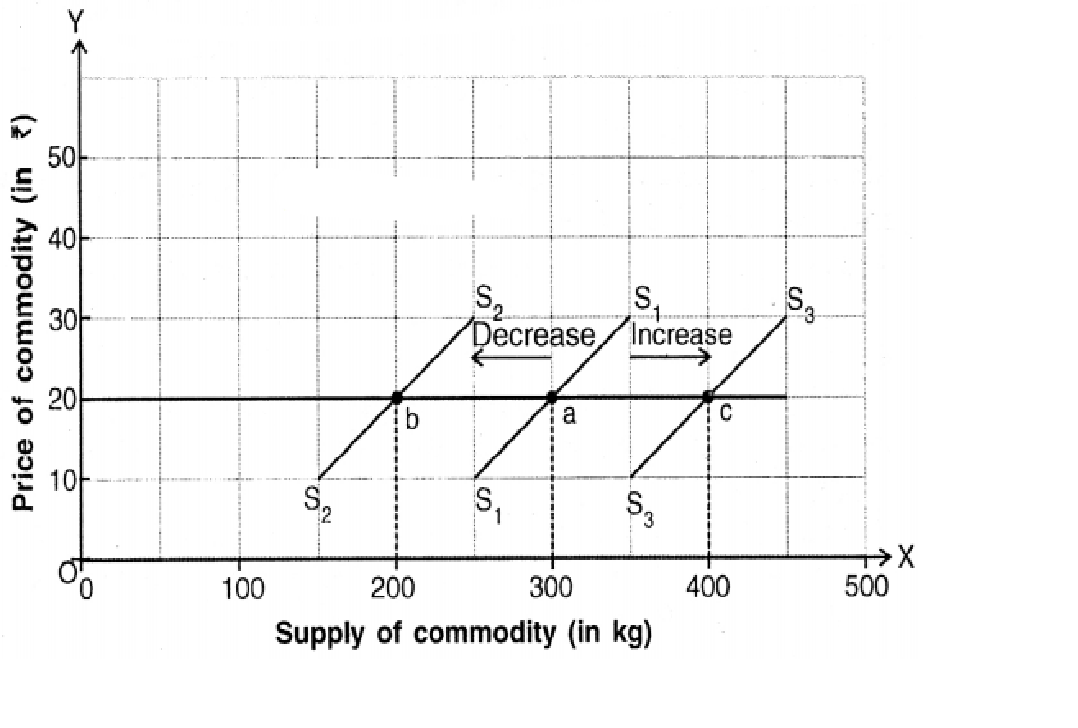
Increase and decrease of supply
- In the diagram, price is represented on the ' $Y$-axis and supply on the '$X$-axis.
- Initial supply curve is represented by $\mathrm{S}_1 \mathrm{~S}_1$. Here, at price of $₹ 20$ the supply of apples is 300 kg . This is plotted as point 'a' on the supply curve $S_1 S_1$.
Increase in supply:
- When price remains constant at $₹ 20$ but one or some of the other factors change in favour of supply of apples then the supply curve shifts to the right to $S_3 S_3$ and the supply of apples increases to $400 \ kg$ . This is indicated by rightward movement of supply curve from point ' $a$ ' to point ' $c$ ' on $\mathrm{S}_3 \mathrm{~S}_3$.
- At constant price, if one or some of the other factors change against the supply of apples then the supply curve shifts to the left to $\mathrm{S}_2 \mathrm{~S}_2$ and the supply of apples decreases to $200 \ kg$ . This is indicated by leftward movement of supply curve from point ' $a$ ' to point ' $b$ ' on $\mathrm{S}_2 \mathrm{~S}_2$.