Question 13 Marks
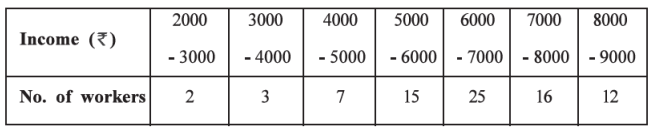
The following data represent monthly income (in ?) of workers in a factory. Find their mean income.
Answer
We first find the mid-value of each class.mid-value $=\frac{\text { upper limit of the class }+\text { lower limit of the class }}{2}$These mid-values will be $2500, 3500, 4500, 5500, 6500, 7500, 8500$. We will take $A = 5500$. The deviations $x — A$ will be $—3000, —2000, —1000, 0,1000, 2000, 3000$ respectively.As these deviations have the highest common factor $c=1000$, we will take $d=\frac{x-A}{c}=\frac{x-5500}{1000}$.Calculations for mean are shown in the following table :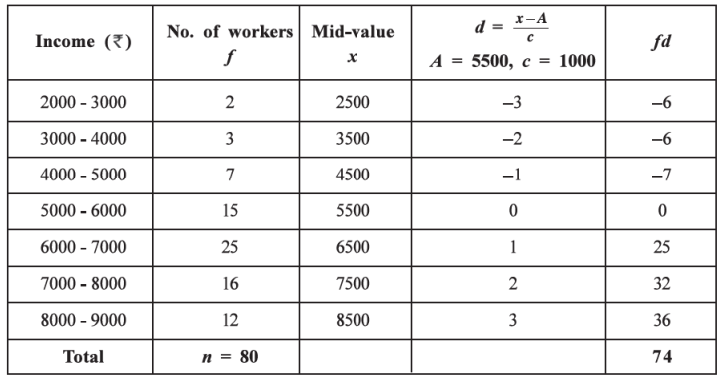
Mean $ \bar{x} =A+\frac{\sum f d}{n} \times c$
$ =5500+\frac{74}{80} \times 1000$
$ =5500+\frac{74000}{80}$
$ =5500+925$
$ =6425$
Thus, the mean income of these workers is $Rs. 6425.$ View full question & answer→Question 23 Marks
The price of an item changes from shop to shop. The following data are available. Find the mean price.
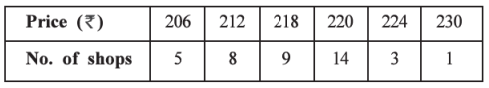
AnswerAs the observations are large, we will calculate the mean using short cut method in which, we will select $A = 220$. The deviations of all observations from A will be $—14, —8, —2, 0, 4, 10$. These deviations have the highest common factor $6 = 2$.
Hence we will take $d=\frac{x-A}{c}=\frac{x-220}{2}$
Calculations for mean
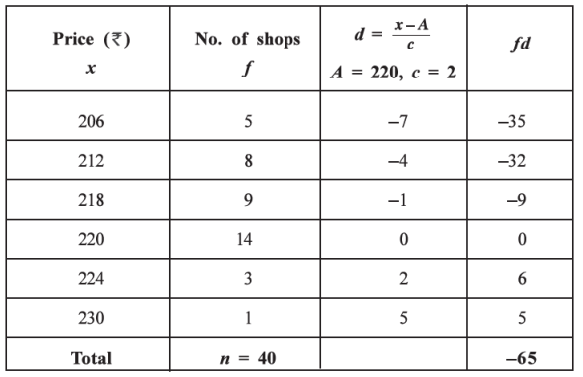
$ \text { Mean } \bar{x} =A+\frac{{\sum} f d}{n} \times c$
$ =220+\frac{(-65)}{40} \times 2$
$ =220+\frac{(-130)}{40}$
$ =220-3.25$
$ =216.75 $
Thus the mean price of this item is ₹ $216.75$. View full question & answer→Question 33 Marks
The time (in minutes) taken by a bus to travel between two towns on different days is shown in the following table.
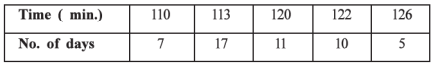
Find the mean travel time.
AnswerHere the values of observations are large.
We will take assumed mean $A=120$.
The deviations are $110-120=-10,113-120=-7,120-120=0,122-120=2$, $126-120=6$.
There is no common factor in them other than $1$ .
Hence we will take $c=1$ Thus we will have $d=\frac{x-A}{c}=\frac{x-120}{1}=x-120$ The calculations for mean will be as follows: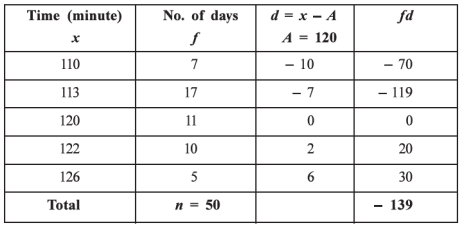
Mean $ \bar{x} =A+\frac{\sum{f}d}{n} \times c$
$ =120+\frac{(-139)}{50} \times 1$
$ =120-2.78$
$ =117.22 $
Thus, the mean travel time for the bus is $117.22$ minutes View full question & answer→Question 43 Marks
$(1)$ The mean of a variable $x$ is $25$ . Find the mean of the variable obtained by first subtracting $3$ from $x$ and then dividing it by $2$ .
$(2)$ The relation between price $(p)$ of an item and its demand $(d)$ is $d=50-2 p$. If the median of price is $₹ 11$, find the mean of demand.
$(3)$ The mode of salaries of employees of a company is $₹ 8500$. The company has decided to deduct $2 \%$ of each employee's salary for welfare fund. Find the mode for the amount of this fund.
Answer$(1)$ Here $y=\frac{x-3}{2}$. As $\bar{x}=25$,
$ \bar{y} =\frac{\bar{x}-3}{2}$
$ =\frac{25-3}{2}$
$ =\frac{22}{2}=11 $
Thus, the mean of $y$ is $11$ .
$(2)$ $d=50-2 p$ and median of price $(p)$ is $11$ .
$ \therefore \text { median of demand }(d) =50-2(\text { median of } p)$
$ =50-2(11)$
$ =50-22$
$ =28 $
Thus, the median of demand is $28$ items.
$(3)$ The mode of salaries $(x)$ of employees is $₹ 8500$
$ \text { Amount of welfare fund }(y) =2 \% \times x$
$ =0.02 \times $
$ \therefore \text { mode for the amount of welfare fund }(y) =0.02(\text { mode of } x)$
$ =0.02 \times 8500$
$ =170 $
Thus, the mode for the amount deducted for welfare fund is $₹ 170$.
View full question & answer→Question 53 Marks
The number of patients arriving at a clinic each hour during working hours of a day are recorded as follows.
$3, 5, 4, 2, 7, 8$
Find the mode for number of patients.
AnswerAs all the values are appearing only once, we can’t find the most common observation. Hence the mode for the number of patients cannot be found from the given data using the definition.
For continuous frequency distribution :
When the data are converted into a frequency distribution with classes, the exact values of the observations are not available.
Similar to median, for mode also, the class containing mode is found first and the value of mode is found using it.
The class having maximum frequency is called as modal class of the frequency distribution. The mode is further obtained using the following formula.
Mode $M_{o}=L+\frac{f_{m}-f_{1}}{2 f_{m}-f_{1}-f_{2}} \times c$
Where $L=$ lower boundary point of the modal class
$ f_{m}=\text { frequency of the modal class }$
$ f_{1}=\text { frequency of the class prior to modal class }$
$ f_{2}=\text { frequency of the class succeeding to modal class }$
$ c=\text { class length of the modal class } $
Note : The above formula can be used only if the distribution has classes of equal class length. Moreover, the formula can be used only in those cases where the maximum frequency is only for one class.
View full question & answer→Question 63 Marks
The mean weight of a group of $20$ persons was found to be $55 \ kg$. Later, it was discovered that one of them reported her weight as $45 \ kg$ which was actually $54 \ kg$. Find the correct mean of their weights.
AnswerHere, $\bar{x}=55$ and $n=20$
Mean $\bar{x}=\frac{2 x}{n}=55$
$\therefore \frac{\Sigma x}{20}=55$
$\therefore \Sigma x=55 \times 20=1100$
Thus the sum of observations is $1100$ which includes a wrong value $45$ instead of the correct value $54$. To find the correct sum of observations, we subtract the wrong observation and add the correct observation.
$ \therefore \text { correct } \Sigma x =1100-45+54$
$ =1109$
$\therefore \text { correct mean } =\frac{\operatorname{correct} \Sigma x}{n}$
$ =\frac{1109}{20}$
$ =55.45 $
Thus, the correct mean weight is $55.45 \mathrm{~kg}$.
View full question & answer→Question 73 Marks
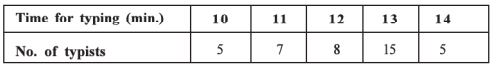
The time required for typing a report by different typists is given in the following data. Find the median typing time using it.
AnswerThe cumulative frequency distribution is as follows :
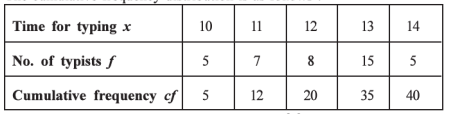
Here, $n=\Sigma f=40$
Median $M=$ value of the $\left|\frac{n+1}{2}\right|$ $th$ observation
$=$ value of the $\left(\frac{40+1}{2}\right)$ th observation
$=$ value of the $20.5$ th observation
$ =\frac{\text { value of the } 20 \text { th observation }+\text { value of the } 21 \text { st observation }}{2} $
It can be known from the cumulative frequencies that the $13 th$ to the $20 th$ observations have value $12$ and the $21$ th to the $35$ th observations have value $13 .$
Thus, the $20 th$ and the $21 st$ observations are $12$ and $13$ respectively.
$ \therefore M =\frac{12+13}{2}$
$ =12.5 $
Thus, the median time required for typing is $12.5 \mathrm{~min}$. View full question & answer→Question 83 Marks
A team has to score with a run rate of $8.25$ in $20$ overs to win the match. The run rate at the end of $12$ overs is $7.25$ What should be the least run rate to be maintained in the remaining overs to win the match ?
AnswerWe know that run rate $=\frac{\text { Total number of runs }}{\text { Total number of overs }}$ = mean of runs $\text { Thus we will take run rate as mean of runs per over. } $
$ \text { Here } n_{1}=12, n_{2}=8$
$\bar{x}_{c}=\text { mean number of runs from all } 20 \text { overs } $
$=8.25 \text { runs }$
$\bar{x}_{1}= \text { mean runs in the first } 12 \text { overs }=7.25 \text { runs. } $
$ \text { Combined mean } \bar{x}_{c}=\frac{n_{1} \bar{x}_{1}-n_{2} \bar{x}_{2}}{n_{1}-n_{2}} $
$\therefore 8.25=\frac{12(7.25)+8 \bar{x}_{2}}{12+8}$
$ \therefore 8.25=\frac{87+8 \bar{x}_{2}}{20} $
$ \therefore 8.25 \times 20=87+8 \bar{x}_{2} $
$ \therefore 165=87+8 \bar{x}_{2} $
$ \therefore 8 \bar{x}_{2}=165-87=78$
$\therefore \bar{x}_{2}=\frac{78}{8} $
$ =9.75$
Thus, minimum run rate for this team in the last $8$ overs should be $9.75$ runs to win the match.
View full question & answer→Question 93 Marks
The mean perfume content in the bottles filled by a perfume manufacturer’s machine should be between $29.6$ ml and $30.4$ ml. The $7$ bottles tested had the following perfume contents (in ml) :
$30.2, 28.9, 29.2, 30.1, 29.4, 31.3, 31.4$
Is the machine working properly ?
AnswerWe find the mean of quantity of perfumes in $7$ bottles.
$\overline{ x }=\frac{\sum x }{ n }=\frac{30.2+28.9+29.2+30.1+29.4+31.3+31.4}{7}=\frac{210.5}{7}=30.07 \ ml$
The mean of quantity of perfumes $30.07$ ml is in the interval $29.6$ to $30.4$ Therefore, machine works properly.
View full question & answer→Question 103 Marks
The economy growth rates of a state for four consecutive years are $2 \%, 2.5 \%, 3 \%, 4 \%$ respectively. Find the average growth rate using an appropriate average.
AnswerRate of economic growth is given in percentage. Therefore, an appropriate measure of average is geometric mean.
$x_1=100+2=102$
$x_2=100+2.5=102.5$
$x_3=100+4=104$
$x_4=100+3=103$
Average growth rate:
$\mathrm{G} =\sqrt[4]{x_1 \cdot x_2 \cdot x_3 \cdot x_4}$
$=\sqrt[4]{102 \times 102.5 \times 104 \times 103}$
$=\sqrt[4]{111993960}$
$=\sqrt{\sqrt{111993960}}$
$=\sqrt{10852.72}$
$=102.87$
Hence, average growth rate of economic $=(102.87-100)$
$=2.87 \%$
View full question & answer→Question 113 Marks
Which average is called as optimum average? Why ?
Answer
- Among all the measure of average, the mean is called as optimum average because
- The value of mean satisfies many of the characteristics of an ideal average, Therefore it is widely, Use for the analysis of statistical data.
- It is the exclusive characteristics of mean that it is most convenient measure of average for special algebric operations.
- To study the various characteristics of population or to compare two or more populations, as a measure of average only mean is used in advanced statistical methods.
View full question & answer→Question 123 Marks
Compare mean and median as the measures of central tendency.
Answer
| No. |
Mean |
No. |
Median |
| $1.$ |
It is a mathematic average. |
$1.$ |
It is a positional average. |
| $2.$ |
It is the value obtained by dividing the sum
of observations by the
number of observations |
$2.$ |
It is the middle most value of the observations arranged
in order. |
| $3.$ |
It is an ideal measure of average for numerical data. |
$3.$ |
It is a convenient measure of average for qualitative data. |
| $4.$ |
Its value is affected by too large or too
small observations of
the data. |
$4.$ |
Its value is not affected by too large or too small observations of the data. |
| $5.$ |
It cannot be obtained for open ended
frequency distribution. |
$5.$ |
It can be obtained for Open – ended frequency |
| $6.$ |
It is a suitable measure for further
algebric operations. |
$6.$ |
It is not convenient measure of average for
algebric operations. |
| $7.$ |
It is obtained when the observations of
the data are uniformly distributed around a
central value. |
$7.$ |
It is convenient measure of average when the observations of the data are not distributed uniformaly
around a central value. |
View full question & answer→Question 133 Marks
Explain the positional averages briefly.
Answer
- If the observations of the data are not distributed around the average, then mean is not good. representative measure of observations of the data.
- In this circumstances to know the characteristic of the data at various places.
considering the observations related to particular place of the data, the measure of average is obtained.
- Such measure of average is known as the positional average.
- Median is such a positional average. Besides this Quartiles, Deciles and Percentiles are also the measures of the positional average.
Median :
- The value of observation dividing the observations of the data arranged in ascending or descending order of magnitudes Into two equal parts is called median of the data.
- It is denoted by M. It represent the average value of 50% of observations.
Quartiles :
- The values of observations dividing the sequence of observations of a given data arranged in the increasing or decreasing order of their magnitudes.
- into four equal parts are called Quartiles.
- There are three Quartiles and they are symbolically denoted as $Q_1, Q_2$ and $Q_3$.
Deciles :
- The values of observations dividing the observations of a given data arranged in Increasing or decreasing order of their magnitudes in ten equal parts are called Deciles.
- There are $9$ deciles. They are denoted by the symbol $D_1, D_2, D_3 \ldots \ldots D_9$.
Percentiles :
- The values of observations dividing, the observations of a given data arranged in increasing, or decreasing order of their magnitudes in hundred equal parts are called Percentiles.
- There are $99$ Percentiles. They are denoted by symbol $\mathrm{P}_1, \mathrm{P}_2, \mathrm{P}_3, \ldots . . \mathrm{P}_{99}$.
View full question & answer→Question 143 Marks
Explain the use of mode as a measure of central Tendency.
Answer
- In day to day practice, many times we State like, on an average the daily wage of workers of a factory is $Rs\ 110$.
- On an average the daily production of a company is $50$ units, the average life of a person in our country is $70$ years, etc.
- In all these statements the context of the measure of an average is to the observation that occurs maximum number of time.
- It indicates a general value of observations.
- Such general value representing the average indicates the value of mode.
- Thus, the value of observation occuring the maximum number of time in the data is called mode.
- It is denoted by $M_0$.
View full question & answer→Question 153 Marks
Define geometric mean and state its advantages.
AnswerIf n observations $x _1, x _2, \ldots . x _{ n }$ of the data are positive and non-zero. then nth root of the product of these observations is called geometric mean. It is denoted by $G$. Its formula is as follows :
$G=\sqrt[n]{x 1, x 2, \ldots . x n}$
Advantages of Geometric mean :
- It is rigidly defined.
- it is based on all observations of the data.
- It is a stable measure.
- It is suitable for algebric process.
- It balances the effect of too large or too small observations of the data and its value is less Chan mean.
View full question & answer→Question 163 Marks
The mean daily sale of a company is $126.2$ units. The sales on $10$ days after adopting a new advertising strategy are as follows :
$156, 125, 162, 153, 130,124, 127, 142, 149, 121.$
Can we say that mean sale has increased by new advertising strategy ?
AnswerMean of daily sales $= 126.2$ Units
Mean of daily sales after the new policy of advertisement,
$\overline{ x }=\frac{\sum x }{ n }=\frac{156+125+162+153+130+124+127+142+149+121}{10}=\frac{1389}{10}=138.9$ units.
Due to new policy of advertisement the mean of daily sales has been increased from $126.2$ units to $138.9$ units. Therefore, it can be said that due to new policy of advertisement the daily sales has been increased.
View full question & answer→Question 173 Marks
$3$ students from a group of $18$ students failed in the examination for the subject of Economics. The marks obtained by the $15$ students who passed are as follows :
$42, 65, 53, 75, 43, 50, 68, 57,79, 48, 51, 61, 55, 70, 64.$
Find the median marks of all $18$ students.
AnswerSuppose marks of $3$ students who fail are $x_1, x_2, x_3$ Usually these marks will be less than the marks of the students who pass. Therefore, $18$ observations are arranged in ascending order as follows :
$x_1, x_2, x_3, 42,43,48,50,51,53,55,57,61,64,65,68.70,75,79$
Here, $n =18$
Median of marks of the student:
$M=$ Value of $\left(\frac{ n +1}{2}\right)$ th observation
Value of $\left(\frac{18+1}{2}\right)=9.5$ tn observation
$=\frac{\text { value of } 9 \text { th observation }+ \text { value of } 10 \text { th observation }}{2}$
$=\frac{53+55}{2}=\frac{108}{2}=54$ marks
View full question & answer→Question 183 Marks
The mean of $50$ observations is $35.$ Later on, it was known that the value of one observation was taken as $50,$ which was wrong. Find the mean of remaining observations by excluding the wrong observation.
AnswerHere, $n=50 ; x=35$
$\therefore$ Sum of 50 observations $= n -\overline{ x }=35$
$=50 \times 35=1750$
We have to find mean of the remaining observations after cancelling the wrong observation taken in calculation.
$\therefore n =50-1=49$
Sum of observation $=1750-50=1700$
$\therefore$ Mean of remaining observation $=\frac{1700}{49}=34.69$
View full question & answer→Question 193 Marks
The mean of marks Scored by $34$ boys in a class is $57.$ The mean of marks of all $60$ students of the class is $59.$ Find the mean marks scored by the girls.
AnswerHere, $n _1=$ No. of boys $=34$
$n _2=$ No. of girls $=$ Total number of Students $-34=60-34=26$
$\overline{x_1}=$ Mean of marks of boys $=57$
$\overline{x_2}=$ Mean of marks of girls $= ?$
$\overline{x_c}=$ Mean of marks of students $=59$
Now, $\overline{x_c}=\frac{n_1 \overline{x_1}+n_{2 \overline{x_2}}}{n_1+n_2}$
Putting $n_1=34, \overline{x_1}=57, n_2=26$ and $\overline{x_c}=59$ in the formula.
$59=\frac{(34 \times 57)+26 \overline{x_2}}{34+26}$
$\therefore 59=\frac{1938+26 \overline{x_2}}{60}$
$\therefore 59 \times 60=1938+26 \overline{ x _2}$
$\therefore 3540-1938=26 \overline{ x _2}$
$\therefore 1602=26 \overline{ x _2}$
$\therefore \overline{ x _2}=\frac{1602}{26}$
$\therefore \overline{ x _2}=61.62$
Hence, the mean of marks scored by girls $=61.62$ marks .
View full question & answer→Question 203 Marks
State the characteristics of an ideal average.
Answer
- It should be well defined. clear and precise.
- It should be easy to understand and calculate.
- It should be based on all the observations of the data.
- It should be suitable for further algebraic operations.
- It should be a stable measure. i.e, it should be free from sampling effects.
- It should not be unduly affected by too large or too small observations.
- It should be widely used in data analysis.
View full question & answer→Question 213 Marks
Find all quartiles for the data given below about marks scored by $15$ students in class test $8,6,7,0,2,4,6,5,5,4,8,9,3,6,7$.
AnswerArranging the observations on marks in ascending order.
$0, 2, 3, 4, 4, 5, 5, 6, 6, 6, 7, 7, 8, 8, 9$ Here, $n = 15$
First Quartile:
$\mathrm{Q}_1=$ Value of $\left(\frac{n+1}{4}\right)$ th observation
$=$ Value of $\left(\frac{15+1}{4}\right)=\left(\frac{16}{4}\right)=4$ th observation
$=4$ Marks
Hence, first quartile $=4$ marks.
Second Quartile:
$\mathrm{Q}_2=$ Value of $2\left(\frac{n+1}{4}\right)$ th observation
$=$ Value of $2(4)$
$=8$ th observation $=6$ marks
Hence, second quartile $=6$ marks.
Third Quartile:
$\mathrm{Q}_3=$ Value of $3\left(\frac{n+1}{4}\right)$ th observation
= Value of $3(4)=12$ th observation $=7$ marks
Hence, third quartile $=7$ marks.
View full question & answer→Question 223 Marks
2 officers, 10 clerks, and 3 peons contributed to a staff picnic. The contribution collected per person is shown in the following table.
|
Officer
|
Clerk
|
Peon
|
|
$₹ 1000$
|
$₹ 500$
|
$₹ 200$
|
Find the mean contribution per person using weighted mean. Answer
For weighted mean, we take the number of staff as weight. calculation is shown in the following table :
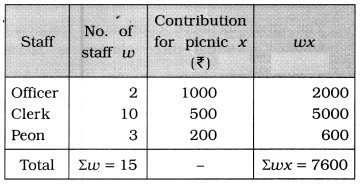
Mean of individual contribution :
$\overline{\mathrm{X}}_{\mathrm{w}}=\frac{\Sigma w x}{\Sigma w}$
Putting $\Sigma w x=7600$ and $\sum w=15$ in the formula,
$\bar{x}_w=\frac{7600}{15}$
$ \bar{x}_w=₹ 506.67$
Hence, mean of individual contribution $=₹ 506.67$. View full question & answer→Question 233 Marks
Find the weighted mean of the percentage change in prices from the following data:
|
Food item
|
Rice
|
Wheat
|
Tea
|
Sugar
|
Pulses
|
|
Weight
|
$7$
|
$10$
|
$5$
|
$8$
|
$2$
|
|
Percentage change in price
|
$134$
|
$125$
|
$115$
|
$97$
|
$120$
|
AnswerHere. weights corresponding to the percentage change in price are given. Therefore, for the calculation of weighted mean the table Isprepared as follows :
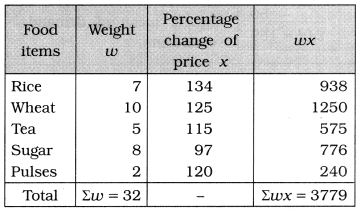
Weighted mean of percentage change of price:
$\overline{\mathrm{x}}_{\mathrm{w}}=\frac{\Sigma w x}{\Sigma w}$
Putting $\Sigma w x=3779$ and $\Sigma w=32$ in the formula,
$\bar{x}_w=\frac{3779}{32}$
$ \therefore \bar{x}_w=118.09 \%$
Hence, weighted mean of percentage change in price $=$
$118.09 \%$ View full question & answer→Question 243 Marks
The following table gives the diameters (in mm.) of different screws selected from a large consignment. Find the mean diameter.
|
Diameter of the screw (mm.)
|
$30$
|
$35$
|
$40$
|
$45$
|
$50$
|
$55$
|
|
No of screws
|
$4$
|
$10$
|
$15$
|
$8$
|
$5$
|
$3$
|
Answer
| Diameter of the screw (mm) x |
No. of screws f |
f. x |
| $30$ |
$4$ |
$120$ |
| $35$ |
$10$ |
$350$ |
| $40$ |
$15$ |
$600$ |
| $45$ |
$8$ |
$360$ |
| $50$ |
$5$ |
$250$ |
| $55$ |
$3$ |
$165$ |
| Total |
n = 45 |
Σfx = 1845 |
Mean of diameter of screw :
$\overline{\mathrm{X}}=\frac{\Sigma f x}{n}$
$=\frac{1845}{45}$
$=41 \mathrm{~mm}$ View full question & answer→Question 253 Marks
In a school the number of teachers having $7, 8, 9, 10$ and $11$ years of experience are respectively $4, 5, 7, 5$ and $2$. Find the value of mode.
View full question & answer→Question 263 Marks
In a society the number of families having $1, 2, 3$ and $4$ children are respectively $3, 8, 6$ and $3$. Find the mode.
View full question & answer→Question 273 Marks
The mode of $10$ observations of a data is $22$. If $2$ is subtracted from each observation and then divided by $5$, find the new value of mode.
View full question & answer→Question 283 Marks
Find the mode of the observations $1.9, 1.99, 0.9, 0.99, 1.90, 1.09, 0.09, 1.0, 1.19, 1.9$. If each observation is increased by $1.04$ and then divided by $2$, find the new value of the mode.
Answer$M_{0}=1.90$, New value $=1.47$
View full question & answer→Question 293 Marks
In a given data $7$ observations are such that the value of each is $68$, while the values of the remaining $4$ observations are $70$ each. Find median and quartiles of the data.
Answer$M=68, Q_{1}=68, Q_{3}=70$
View full question & answer→Question 303 Marks
For a frequency distribution of $P_{25}=45, D_{5}=52$ and $P_{75}=60$, find $M, Q_{1}, Q_{3}$.
Answer$M=52, Q_{1}=45, Q_{3}=60$
View full question & answer→Question 313 Marks
Find the values of two extreme quartiles, $D_{9}$ and $P_{40}$ of the observations $-8,12,0,1,-4,2,-2,7,-3,5,-1$. If each observation is multiplied by $\frac{1}{2}$ then obtain the new value of each.
Answer$Q_{1}=-3, Q_{3}=5, D_{9}=11, P_{40}=-1.20 ;$
New values: $Q_{1}=-\frac{3}{2}, Q_{3}=5, D_{9}=\frac{11}{2} P_{40}=$ $-0.60$
View full question & answer→Question 323 Marks
From the students residing in a hostel, the daily expense of $25$ students is $Rs. 60$ or less, that of $13$ students it is $Rs. 30$ or less, that of $23$ students it is $Rs\ 50$ or less, that of $19$ students it is $Rs. 40$ or less and that of $5$ students it is $Rs. 20$ . Find median, mode, $D_{6}$ and and $P_{90}$ of daily expense of students.
Answer$M=30 \mathrm{Rs}, M_{0}=30 \mathrm{Rs}, D_{6}=40 \mathrm{Rs}, P_{90}=$ $541 \mathrm{Rs} .$
View full question & answer→Question 333 Marks
The value of a machine depreciates at the rate of $10 \%, 7 \%, 5 \%$ and $2 \%$ in its first four years respectively. Find the average rate of depreciation using an appropriate method.
AnswerHere, the depreciation values of a machine are given in percentage. Therefore, an appropriate average of depreciation is geometric mean.Considering the Percentage depreciation of value of a machine, we get the following.
observation:
$x_1=100-10=90 ; x_2=100-7=93 ; x_3=100-5=95 ; x_4=100-2=98$
Average of depreciation :
$G=\sqrt[4]{x_1 X x_2 X x_3 X x_4}=\sqrt[4]{90 \times 93 \times 95 \times 98}=\sqrt[4]{77924700}=\sqrt{\sqrt{77924700}}=\sqrt{8827.4968}=93.95$
Hence, average rate of depreciation is four years $=(100-93.95)=6.05 \%$
View full question & answer→Question 343 Marks
The following data show the number of books read by $8$ students Of a class during last month :
$2,1, 5. 9, 1, 3, 2, 4$
Find the average number of books read using geometric mean.
AnswerHere, $x_1=2 ; x_2=1 ; x_3=5 ; x_4=9 ; x_5=1 ; x_6=3 ; x_7=2$ and $x_8=8$
Geometric mean of books read :
$G=\sqrt[8]{ x _1 X x_2 X x_3 X x _4 X x_5 X x_6 \cdot x_7 X x_8}=\sqrt[8]{2 \times 1 \times 5 \times 9 \times 1 \times 3 \times 2 \times 4}=\sqrt[8]{2160}=\sqrt{\sqrt{\sqrt{2160}}}=$
$\sqrt{\sqrt{46.4758}}=\sqrt{6.8173}=2.61$ books
Hence, mean of books read $=2.61$ books.
View full question & answer→