Questions

5 Marks Each

🎯

Test yourself on this topic

8 questions · timed · auto-graded

Question 15 Marks
Draw a divided column graph of urban and rural population of India from the information given below.
Year Rural Population Urban Population Total Population
$1901$ $21.2$ $2.6$ $23.8$
$1951$ $29.9$ $6.2$ $36.1$
$1981$ $52.4$ $15.9$ $68.3$
$2011$ $83.02$ $38.0$ $121.02$
Answer
 
The graph column showing the year on the x-axis and the percentage on the $y$-axis is as follows.
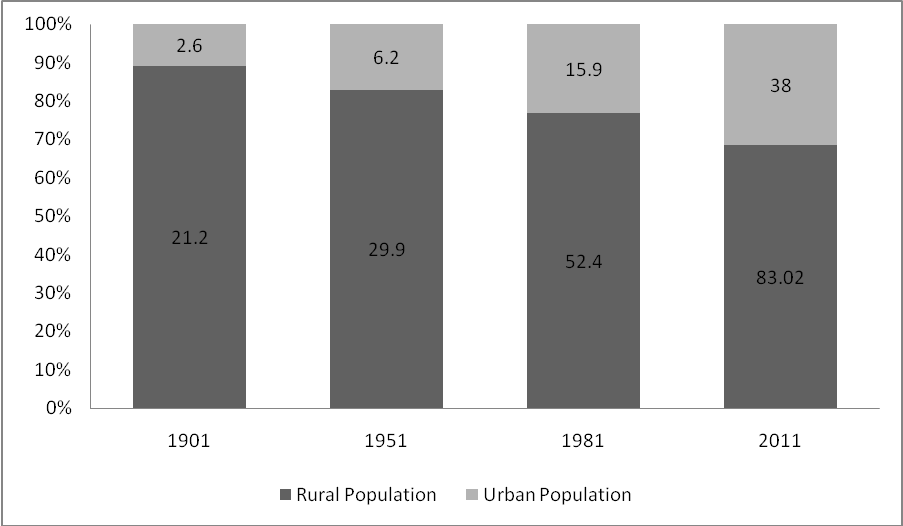
Analysis: $1.$ The graph shows the d,$M$ JNKivided column of urban and rural population on $x$-axis and the percentage of total population on $y$-axis.
$2.$ It is clear from the graph that the urban population is less than the rural population.
$3.$ In the year $1901$, the rural population is $21.2$ crore while the urban population is $2.6$ crore. Rural population is $89.1%$ while urban population is $10.9%.$
$4.$ In the year $1951$, the rural population is $29$ Crore while the urban population is $6.2$ crore. Rural population is $82.8%$ while urban population is $17.2%.$
$5.$ In the year $1981$, the rural population is $52.4$ crore while the urban population is $15.$ Crore. Rural population is $76.72%$ while urban population is $23.28%.$
$6.$ In the year $2011$ the rural population is $83.02$ crore while the urban population is $38.0$ crore. Rural population is $68.0%$ while urban population is $32.0%.$
$7.$ It can be said from the graph that rural population is continuously decreasing while urban population is increasing.
View full question & answer
Question 25 Marks
Draw a column graph from the annual percentage of national income.
Country Norway $USA$ Srilanka China India Pakistan
National Income Growth Rate $(2014)$ $2.2$ $2.4$ $4.5$ $7.3$ $7.3$ $4.7$
Answer
The following is a column diagram showing the growth rate of different countries on the $x$-axis and national income on the $y$-axis.
Analysis: $1.$ The annual percentage growth rate of the country on the $x$-axis and the national income on the $y$-axis are shown $(2014)$.
$2.$ The graph shows that Norway has the lowest growth rate of $2.2%$ while India and China have the highest growth rates of $7.3%$.
$3.$ Secondly, Pakistan's growth rate is $4.7%$. After that, Sri Lanka's growth rate is $4.5%.$
View full question & answer
Question 35 Marks
Analyze the following information about literacy in Gujarat by presenting it in a magazine series article.
Year $1951$ $1961$ $1971$ $1981$ $1991$ $2001$
Literacy $($In $\%)$ $21.69$ $30.45$ $35.79$ $49.90$ $61.29$ $67.97$
Answer
The periodical series graph showing the year on the $x-$axis and the literacy $(\%)$ on the y-axis is as follows. 
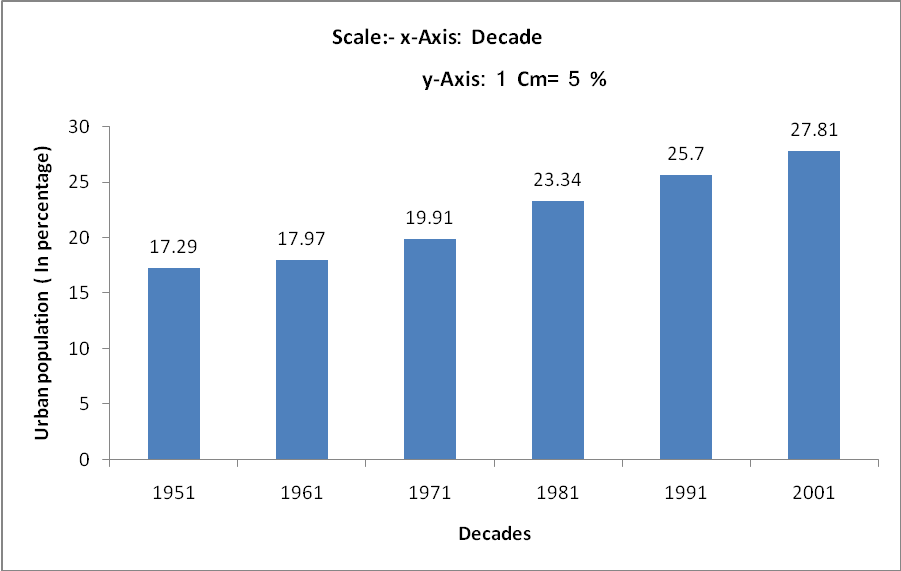
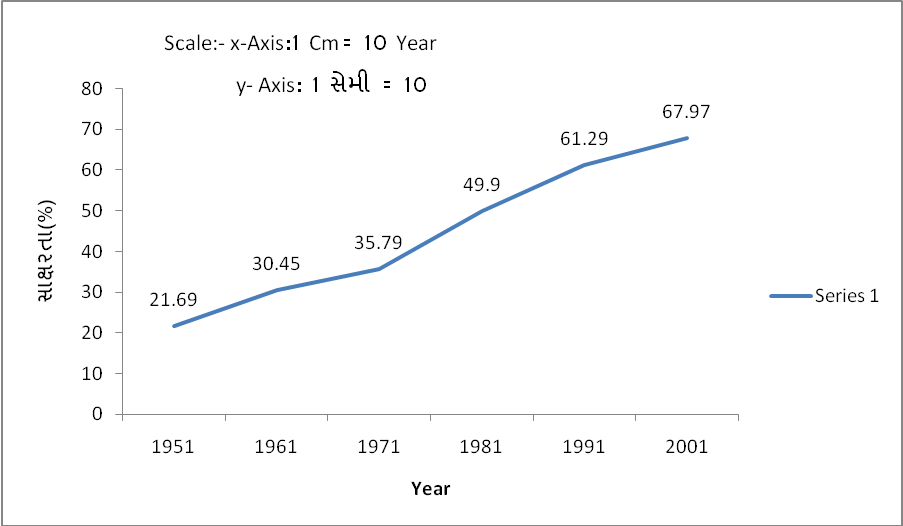
Analysis: $(1)$ The graph shows a period of $10-10$ years on the $X-$axis and the literacy percentage on the $Y-$axis.
$(2)$ The literacy rate of $50$ quill in $UAE$ from $1951-2001$ is almost $3$ times.
$(3)$ The literacy rate has been steadily increasing from $1951-1971,$ while the literacy rate has increased by almost $90\%$ in the $30$ years from $1971$ to $2001.$ For Gujarat, this period was going to be an explosion of literacy.
$(4)$ The trend in literacy in Gujarat has been steadily increasing from $1951$ to $2001.$
$(5)\ 1961–1971-l R44UHİ$ Literacy growth has been slow.
View full question & answer
Question 45 Marks
Draw and analyze the periodic graph from the following information on accidents managed by mutual funds in India during the period March, $1998$ to March, $2004.$
Year March,$1998$ March,$1999$ March,$2000$ March, $2001$ March,$2002$ March,$2003$ March,$2004$
Accident $114$ $152$ $365$ $326$ $492$ $659$ $1329$
Answer
The periodic graph of information on accidents on the $x$-axis, year and $y$-axis is as follows:
Analysis:
$(1)$ The graph shows the period $($years$)$ on the $X$-axis and the assets $($in hundred billion$)$ on the $Y$-axis.
$(2)$ In the period of $7$ years from March, $1998$ to March, $2004$, the assets managed by Utual Fo in India have been doubled.
$(3)$ Assets are expected to grow between March, $1995$ and early March, $1999.$ In fact, assets have fallen from $365$ billion to $326$ billion.
$(4)$ Assets in the village have almost quadrupled between March $2000$ and March $2004.$
$(5)$ The graph shows that the future of assets managed by mutual funds in India is bright.
View full question & answer
Question 55 Marks
Draw pie diagram of the following and analys the data: -:
Sector Investment (In%)
Cash money market $41$
Gilt $3$
Equity related savings plans $1$
Income / dividend $35$
Growth $17$
Balanced $3$
Total $100$
Answer
 
The information provided for drawing a diagram can be shown as follows:
Sector Investment (In %) Degree
Cash money market $41$ $\frac{41}{100} \times 360^{\circ} \approx 147^{\circ}$
Gilt $3$ $\frac{3}{100} \times 360^{\circ} \approx 11^{\circ}$
Equity related savings plans $1$ $\frac{1}{100} \times 360^{\circ} \approx 4^{\circ}$
Income /Dividend $35$ $\frac{35}{100} \times 360^{\circ} \approx 126^{\circ}$
Growth $17$ $\frac{17}{100} \times 360^{\circ} \approx 61^{\circ}$
Balanced $3$ $\frac{3}{100} \times 360^{\circ} \approx 11^{\circ}$
Total 100 $360^{\circ}$
Take the right radius, draw a circle, and divide it according to the numerator of different fields.
Analysis: -
$(1)$ For comparative study the percentage of rock of mutual fund in different sectors in India is presented by the figure.
$(2)$ $76%$ of the total investment of the mutual fund is in the cash money market and income / dividend sectors. Only $24$ per cent of investment is in the areas of growth, equilibrium, gilt, and equity-related savings plans.
View full question & answer
Question 65 Marks
The following is a column showing ten years on the x-axis and the percentage of urban population on the $y-$axis.
Decades $1951$ $1961$ $1971$ $1981$ $1991$ $2001$
Urban population $($percentage of total population$)$ $17.29$ $17.97$ $19.91$ $23.34$ $25.70$ $27.81$
Answer
The following is a column showing ten years on the $x-$axis and the percentage of urban population on the $y-$axis.
Analysis:
$(1)$ The figure shows the years of different decades on the $x$-axis and the percentage of urban population on the $Y$-axis.
$(2)$ From $1951$ to $2001$, the percentage of urban population seems to be steadily increasing.
$(3)$ From $1951$ to $1971$, the urban population increased by about $15\%$. The next $20$ years have seen an indicative increase of about $40$ per cent in the urban population.
$(4)$ In the $50$ years from $1951$ to $2001$, the urban population appears to have grown at a high rate of about $61\%.$
View full question & answer
Question 75 Marks
Analyze the following information on employment in the three main sectors of China and India in $1999$ by presenting the following columns.
Sector Employment
China India
Agriculture $50.0$ $60.5$
Industry $22.0$ $16.8$
Service $28.0$ $22.7$
Answer
The following columns showing the area on the $x$-axis and employment on the $Y$-axis $($in percent$)$ and drawing the first column for China and the second column for India are as follows:
Analysis:
$(1)$ The graph shows the three different sectors of employment of China and India on the $x$-axis and the percentage of employment on the $Y$-axis.
$(2)$ The employment rate in agriculture in India is higher than that in China.
$(3)$ China's investment in industry and services is higher than India's.
$(4)$ In both India and China, employment in agriculture has been higher than in industry and services.
$(5)$ In India and China, the employment opportunities in the industrial sector seem to be less than in the other two sectors.
View full question & answer
Question 85 Marks
Analyze the following statistics by presenting them in a divided column.
$PLAN$ Percentage of total expenditure incurred behind education Total
Primary Secondary Higher and technical
${8^{T H}(1992-97)}$ $48$ $24$ $28$ $100$
${9^{T H}(1997-2002)}$ $66$ $11$ $23$ $100$
Answer
The plan on $x-$axis and the percentage of expenditure on education on $Y$-axis will be divided as follows:
Analysis:
$(1)$ The figure shows the duration of the Eighth and Ninth Five Year Plan on the $x$-axis and the percentage of education expenditure on the $y-$axis.
$(2)$ The Ninth Plan $(1997-20002)$ has spent $37.5$ per cent more on primary education than the Eighth Plan $(1992-97).$
$(3)$ The percentage of expenditure on secondary education in the Ninth Plan as well as the percentage of expenditure on higher and technical education has been reduced by about $54\%$ and $18\%$ as compared to the $8th$ Plan respectively.
$(4)$ The Ninth Plan allocates more money to the costs behind primary education, suggesting a rapid increase in literacy.
View full question & answer
5 Marks Each - Economics STD 12 Arts Questions - Vidyadip