Question 13 Marks
The singing talent of five singers $A, B, C, D$ and $E$ was judged by two judges in a singing competition. The ranks assigned to five singers are as follows.
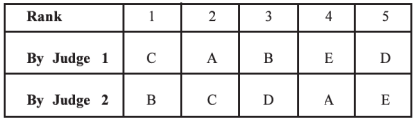
Find the similarity between the decisions of the two judges from the rank correlation coefficient. AnswerHere $n : 5.$ Let us rearrange the given information in terms of ranks given to five singers as follows.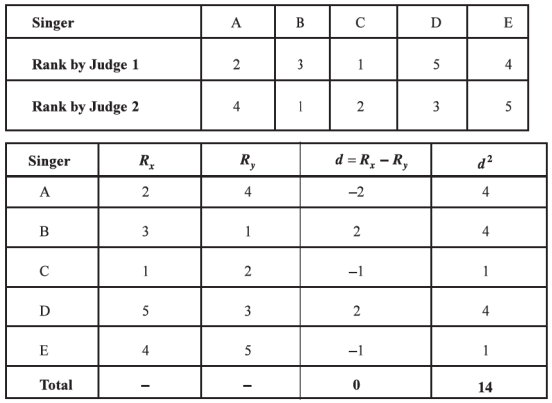
$ r =1-\frac{6 \Sigma d^{2}}{n\left(n^{2}-1\right)}$
$ =1-\frac{6(14)}{5(25-1)}$
$ =1-\frac{84}{120}$
$ =1-0.7$
$\therefore r =0.3 $
The value of $r$ is positive and near to $0.$ So, there is a partial positive correlation. Thus, it can be said that there is less agreement between the judges. i.e. their opinion differ to some extent. View full question & answer→Question 23 Marks
The principal of a school has conducted a test for five students selected in a sample to judge the relation between the knowledge of Mathematics and memory ability in the subject of History of the students. The ranks given to these five students in the subjects of Mathematics and History are given below. Find the rank correlation coefficient between ranks of two subjects using this information.

AnswerHere, $n =5$ and the ranks are already given. So, we prepare the following table to compute the rank correlation coefficient.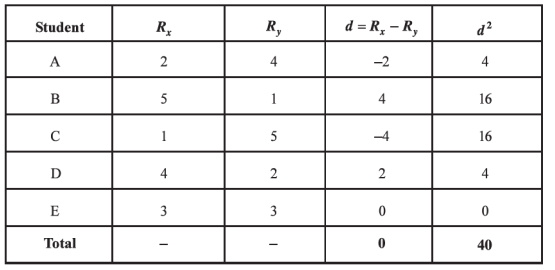
$ r =1-\frac{6 \Sigma d^{2}}{n\left(n^{2}-1\right)}$
$ =1-\frac{6(40)}{5(25-1)}$
$ =1-\frac{240}{120}$
$ =1-2$
$\therefore r =-1 $
Since the performance of five students in Mathematics and History are exactly in opposite order, we get $r = -1.$ View full question & answer→Question 33 Marks
Seven employees are selected from a company. They are judged by two managers from the company in terms of their administrative skills. The ranks given by them are as follows.
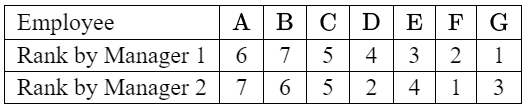
Calculate the rank correlation coefficient between the judgments given by two managers.
AnswerHere, $n = 7$ and the ranks are already given. So, we prepare the following table to compute the rank correlation coefficient.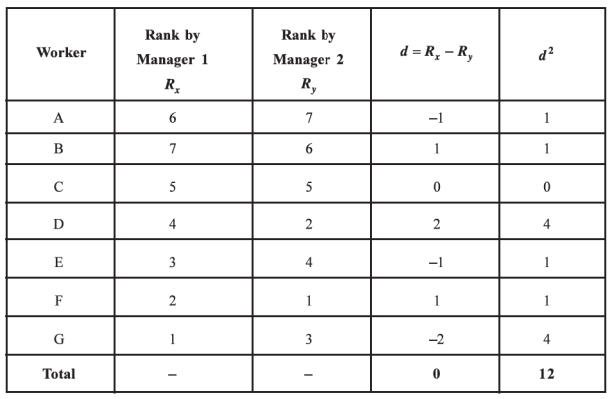
View full question & answer→Question 43 Marks
To study the relationship between the sales and the profit of a company, the following information is obtained for the last six years.
$X$ Annual Sales $($lakh $₹)$
$Y$ Annual Profit $($ten thousand $₹)$
$n=6, \Sigma x=58, \Sigma y=40, \Sigma x y=431, \Sigma x^{2}=606, \Sigma y^{2}=316$
Find the correlation coefficient between $X$ and $Y.$
AnswerSubstituting the given values in the following formula,
$r=\frac{n \Sigma x y-(\Sigma x)(\Sigma y)}{\sqrt{n \Sigma x^{2}-(\Sigma x)^{2}}+\sqrt{n \Sigma y^{2}-(\Sigma y)^{2}}}$
$=\frac{6(431)-(58)(40)}{\sqrt{6(606)-(58)^{2}} \cdot \sqrt{6(316)-(40)^{2}}}$
$=\frac{2586-2320}{\sqrt{3636-3364} \cdot \sqrt{1896-1600}}$
$=\frac{266}{\sqrt{272} \cdot \sqrt{296}}$
$=\frac{266}{\sqrt{80512}}$
$=\frac{266}{283.7464}$
$=0.9375$
$\therefore r \simeq 0.94$
View full question & answer→Question 53 Marks
State the necessary precautions to be taken while interpreting the value of correlation coefficient.
Answer
- The coefficient of correlation measures the strength of linear relationship between two variables.
- The following are some of the points to be kept in mind as precaution to interpret it carefully :
- $(1)$ Spurious Correlation :
- The value of correlation coefficient I does not indicate any cause effect relation or any meaningful relation between two variables.
- In many cases there is no meaningful relation but value of correlation coefficient I calculated on the basis of observations of two variables comes very near to $1.$
- For example there is no meaningful relation between America's per capita income and number of deaths caused due to cancer in India but still if we calculate correlation coefficient r between them by taking observations during a particular time, its value will be near $1.$
- In such cases there is no cause effect relation between two variables $X$ and $Y$ also the increase or decrease in their values are due to other factors.
- Therefore it is wrong to interpret that the two variables are correlated or not correlated on the basis of value of correlation coefficient r.
- $(2)$ Lack of Correlation :
- It is wrong to interpret that there is no correlation between two random variables $X$ and $Y$ when the value of coefficient of correlation is $0 ($zero$).$
- In such cases it can be said that there is lack of linear correlation between two random variables $X$ and $Y.$
- $(3)$ Interpretation of value of correlation coefficient :
- If the correlation coefficient is computed from the data which is related to a given region or class or given time duration then its interpretation should be limited to that region or Class or time duration only.
- The interpretation of such correlation coefficient should not be extended or generalised outside the region, class or time without proper verification in order to avoid any kind of misunderstanding.
View full question & answer→Question 63 Marks
How would you interpret partial correlation ?
Answer
- When the changes in the values of two correlated variables $X$ and $Y$ are in the same direction or in the opposite direction but not in the same proportion then the relation is said to be partial correlation.
- In such cases value of r is $0 < r < 1$ or $-1 < r < 0.$
- If the value of $|r|$ is near to one then we can say that correlation is near to perfect linear correlation and correlation is in very strong proportion.
- In such cases we can interpret the change in the value of one variable due to change in the value of other variable.
- If value of $|r|$ is near to $0$ then we can say that there is lack of linear correlation or strength of linear correlation is less.
- In such case we cannot interpret the change in the value of one variable due to the Change in the value of other variable.
View full question & answer→Question 73 Marks
Write merits and limitations of Spearman’s rank correlation method.
AnswerMerits of Spearman’s rank correlation method : The merits of Spearman’s rank correlation method are as follows :
- This method is easy to understand.
- In calculating correlation coefficient, this method is easier than that of Karl Pearson’s method.
- When the related data is qualitative, this is the only method to find the measure of correlation.
- When there is more dispersion in the related numerical data or the extreme observations are present in the data, Spearman’s method is preferred than Karl Pearson’s method.
Limitations : Following are the limitations of Spearman’s rank correlation method:
- This method does not provide accurate measure of correlation coefficient as compared to Karl Pearson’s method.
- It is tedious to assign ranks when the number of observations is large.
- This method cannot be used for a bivariates frequency distribution.
View full question & answer→Question 83 Marks
Write the merits and limitations of Spearman's rank correlation method.
Answer
- Merits :
- This method is easy to understand and calculate.
- It is the only method when the data is qualitative.
- When dispersion is more or when the extreme observations are present in the data, then this method is preferred.
- When data is in numerical form then also ranks can be assigned according to their magnitude and we can find correlation coefficient.
- When only ranks are given for the two variables then this method is more efficient to use to calculate correlation coefficient.
- Limitation :
- Rank correlation method does not provide accurate value of the correlation coefficient as compared to Karl Pearson's method
- It is tedious to assign ranks when the number of observations is large
- This method cannot be used for bivariate frequency distribution.
- Since the ranks of observations are used instead of its original values, correlating coefficient obtained by this method is not reliable
View full question & answer→Question 93 Marks
Interpret $r = 1, r = -1$ and $r = 0.$
Answer
- $(1)\ r = 1 :$
- If correlation coefficient between two correlated variables $X$ and $Y, r = 1$ then we can say that there is a perfect positive correlation between two variables.
- That means values of both the variables change proportionally in the same direction.
- Coefficient between two variables $X$ and $Y$ can be expressed by the equation $y = a + bx,$ where $b > 0.$
- In such cases all the points on the scatter diagram lie on the line which is going in the upward direction from left to right.
- $(2)\ r = -1 :$
- If correlation coefficient between two correlated variables $X$ and $Y, r = -1$ then we can say that there is a perfect negative correlation between two variables.
- That means values of both the variables change proportionally in the opposite direction.
- Coefficient between two variables $X$ and $Y$ can be expressed by the equation $y = a + bx,$ where $b < 0.$
- In such cases all the points on the scatter diagram lie on the line which is going in the downward direction from left to right.
- $(3)\ r = 0 :$
- If correlation coefficient between two correlated variables $X$ and $Y, r = 0$ the we can say that there is no linear correlation between two variables.
- That means there are random changes in the values of both the variables and changes in the values one variable due to the changes in the values of other variables cannot be estimated.
- In such cases all the points of the scatter diagram lie randomly without forming any specific pattern.
View full question & answer→Question 103 Marks
Write the merits and limitations of Karl Pearson's method.
Answer
- Following are the merits and limitations of Karl Pearson’s method :
- Merits :
- This is the most popular method of measuring correlation between two variables.
- The type (nature) as well as the degree of relationship between two variables can be known by this method.
- Calculation of correlation coefficient between two variables depend on the mere recipients.
- If the data of two correlated variables is given in the form of bivariate table then this is the only method to calculate correlation coefficient.
- Limitations :
- This method is relatively tough in context of calculation.
- Deep knowledge of mathematics is required for the correlation coefficient between two variables.
- The value of correlation coefficient is highly affected by the extreme (too large or too small) observations.
- It depends on the assumption that two variables under consideration have linear relationship.
- If the interpretation of correlation coefficient between two variables is not done carefully then there is a possibility of misconception regarding the relation between two variables.
View full question & answer→Question 113 Marks
Write the properties of correlation coefficient.
AnswerThe properties of correlation coefficient are as follows:
- The value of correlation coefficient $r$ lies in the interval $-1$ to $1 .$ i.e., $-1 \leq r \leq 1$.
- The correlation coefficient $r$ is free from unit of measurement, i.e., it does not have any unit of measurement.
- The correlation coefficient between variables $X$ and $Y$ is same as that of between $Y$ and $X$, i.e., $r(x, y)=r(y, x)$.
- The value of correlation coefficient $r$ does not change with the change of origin and scale, i.e., $r(x, y)=r(u, v)$ where, $\mathbf{u}=\frac{x-\mathrm{A}}{\mathrm{C}_{\mathrm{x}}} ; \mathbf{v}=\frac{y-\mathrm{B}}{\mathrm{C}_{\mathrm{y}}} \cdot \mathrm{C}_{\mathrm{x}}>0, \mathrm{C}_{\mathrm{y}}>0$
- and $A, B, C_x, C_y$ are constant.
- The correlation coefficient $r$ is an absolute measure.
- If the sign of any one of two variables is changed then the sign of the correlation coefficient also changes, i.e., $r(-x, y)=-r(x, y) ; r(x,-y)=-r(x, y)$
- If the signs of both the variables are changed then the sign of the correlation remain unchanged, i.e., $r(-x,-y)$ $=r(x, y)$.
View full question & answer→Question 123 Marks
Write merits and limitations of scatter diagram method.
AnswerFollowing are the merits and limitations of scatter diagram method.
- Merits :
- This is a simple method to know the nature of the correlation between two variables.
- Less mathematical knowledge is required as the knowledge of plotting the points is only requirement in this method.
- It also gives some idea about strength of correlation between two variables.
- There is no difficulty in judging the nature of correlation even if some pairs of extreme observations are present in the data.
- Limitations :
- This method gives nature of correlation and some idea about strength of correlation but it does not give exact degree of relationship between two variables.
- This method is not useful in bivariate frequency distribution.
View full question & answer→Question 133 Marks
The ranks given by two experts on the basis of interviewers of five candidates for a job are $(3,5), (5,4), (1,2), (2,3), (4,1)$. Find the rank correlation coefficient from this data.
Answer
Here, $n = 5; R_x =$ Ranks by first expert; $R_y =$ Ranks by second expert.
The table for calculating rank correlation coefficient is prepared as follows :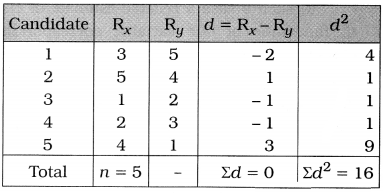
Rank Correlation Coefficient:
Now, $r=1-\frac{6 \Sigma d^2}{n\left(n^2-1\right)}$
Putting $n=5$ and $\sum d^2=16$ in the formula,
$
\begin{aligned}
& r=1-\frac{6 \times 16}{5\left(5^2-1\right)} \\
& =1-\frac{96}{5(25-1)} \\
& =1-\frac{96}{120} \\
& =1-0.8 \\
& =0.2
\end{aligned}
$
Hence, the rank correlation coefficient obtained is $0.2 .$ View full question & answer→Question 143 Marks
The information obtained on the basic of ranks given by two judges to eight contestants of a dance competition is given below: $\sum\left( R _x- R _y\right)^2=126$ Where $R _{ x }$ and $R _{ y }$ are the ranks given to a contestant by two judges respectively. Find Spearman's rank correlation coefficient.
AnswerHere, $n=8$ and $\Sigma\left(R_x-R_y\right)^2=\Sigma d^2=126$ are given.
Spearman's Correlation Coefficient:
Now, $r=1-\frac{6 \Sigma d^2}{n\left(n^2-1\right)}$
$=1-\frac{6 \times 126}{8\left(8^2-1\right)}$
$=1-\frac{756}{8(64-1)}$
$=1-\frac{756}{504}$
$=1-1.5 $
$=-0.5$
Hence, Spearman's rank correlation coefficient obtained is -$0.5 .$
View full question & answer→Question 153 Marks
The following information is obtained for $9$ pairs of observation $\Sigma\bar{x}= 51, \Sigma\bar{x} = 72, \Sigma{x}^2 = 315, \Sigma{y}^2 = 582, \Sigma{xy} = 408.$ Find the correlation coefficient.
AnswerHere, $n=9 ; \Sigma x=51, \Sigma y=72, \Sigma x^2=315, \Sigma y^2=582$ and $\Sigma x y=408$ are given.
$\text { Now, } r =\frac{n \sum x y-\left(\sum x\right)\left(\sum y\right)}{\sqrt{n \sum x^2-(\Sigma x)^2} \cdot \sqrt{n \Sigma y^2-(\Sigma y)^2}}$
$ =\frac{9 \times 408-(51)(72)}{\sqrt{9 \times 315-(51)^2} \cdot \sqrt{9 \times 582-(72)^2}}$
$ =\frac{3672-3672}{\sqrt{2835-2601} \cdot \sqrt{5238-5184}}$
$ =\frac{0}{\sqrt{234} \cdot \sqrt{54}}=\frac{0}{\sqrt{12636}}=\frac{0}{112.41}=0$
Hence, the correlation coefficient obtained is $0 .$
View full question & answer→Question 163 Marks
The following data is available for two variables rainfall in $m m(X)$ and yield of crop $Q t 1 /$ Hectare $(Y) . n=10, \bar{x}=120$, $\bar{y}=150, S_{ x }=30, S_{ y }=40$ and $\Sigma x y=189000$. Find the correlation coefficient.
AnswerHere, $n=10 ; \bar{x}=120 ; \bar{y}=150 ; S_x=30 ; S_y=40$ and $\Sigma x y=189000$ are given.
Now, $r=\frac{\sum x y-n \bar{x} \bar{y}}{n \cdot S _x \cdot S _y}$
$=\frac{189000-10(120)(150)}{10 \times 30 \times 40}$
$=\frac{189000-180000}{12000}=\frac{9000}{12000}=0.75$
Hence, the correlation coefficient obtained is $0.75.$
View full question & answer→Question 173 Marks
Explain scatter diagram method.
AnswerThis method is used to know the nature of correlation between two variables.
- By taking values of variable $X$ on x-axis and corresponding values of $Y$ on $y-$axis with appropriate scale and plotting n sample points $(x_1, y_1), (x_2, y_2)....... (x_n, y_n)$ on the graph paper, a diagram is obtained which is called scatter diagram.
- From the pattern of points on the scatter diagram, nature of correlation and strength of correlation can be known to some extent.
- The following are the types of correlation according to the scatter diagram method.
- $(1)$ Perfect Positive Correlation :
- If all the points of the scatter diagram obtained by plotting $n$ ordered pairs of observations of two correlated variables $x$ and $y,$ lie on one line which goes in upward direction from left to right, then we can say that there is perfect positive correlation between variable $x$ and $y.$
- Where value of $r$ is $+1$.
- When the changes in the values of both the variables are in the same direction and in the same proportion we get the following scatter diagram.
- $(2)$ Perfect Negative Correlation :
- If all the points of the scatter diagram obtained by plotting $n$ ordered pairs of observations of two correlated variables $x$ and $y,$ lie on one line which goes in downward direction from left to right ,then we can say that there is perfect negative correlation between variable $x$ and where value $r$ is $-1.$
- When the changes in the values of both the variables are in the opposite direction and in the same proportion we get the following scatter diagram.
- $(3)$ Partial positive correlation :
- If all the point of scatter diagram are not on one line but lie around line which is going in upward direction from left to right then we say there is partial positive correlation between $x$ and $y$ where value of $r$ lies between $0$ and $1.$
- When the changes in the values of both the variables are in the same direction but not in the same proportion we get the following scatter diagram.
- $(4)$ Partial negative correlation :
- If all the point of scatter diagram are not on one line but lie around line which is going in downward direction from left to right then we say there is partial positive correlation between $x$ and $y$ where value of r lies between $-1$ and $0.$
- When the changes in the values of both the variables are in the opposite direction but not in the same proportion we get the following scatter diagram.
- $(5)$ Lack of correlation :
- If all the points of scatter diagram are not in particular direction but lie randomly without forming any specific pattern then we can say that there is lack of correlation.
View full question & answer→Question 183 Marks
Explain the cause and effect relationship.
Answer
- In the begining of the study of correlation between two variables, we make assumption that there is relation of cause and effect between two variables.
- In same cases even though there is no relation of cause and effect between two variables, variable values are fluctuated.
- For that some other factors are responsible.
- Such a correlation is called meaningless correlation.
- Thus, for appropriate representation of correlation co-efficient caution about cause and effect between two variables is necessary.
- Illustrations :
- $(1)$ If age of person is variable $X$ and his weight is variable $Y.$
- Here, weight increases because age increases.
- It indicates that weight is effect of age, which is cause.
- $(2)$ When the income of a person remains more or less or same, if his expenditure increases, saving decreases and if his expenditure decreases, saving increases.
- Here, saving is the effect and expenditure is a cause.
View full question & answer→Question 193 Marks
The coefficient of rank correlation of the marks obtained by $10$ students in two particular subjects was found to be $0.5.$ Later on, it was found that one of the differences of the ranks of a student was $7$ but it was taken as $3.$ Find the corrected value of the correlation coefficient.
AnswerHere, $n = 8; r = 0.5$
True difference $= 7.$ False difference $= 3$
Now., $r=1-\frac{6\left(\Sigma d^2+C F\right)}{n\left(n^2-1\right)} 2$
Putting $n = 10$ and $r = 0.5$ in the formula.
$0.5=1-\frac{6 \Sigma d^2}{10\left(10^2-1\right)}$
$\therefore \frac{6 \Sigma d^2}{10(100-1)}=1-0.5$
$\therefore \frac{6 \Sigma d^2}{990}=0.5$
$\therefore \Sigma d^2=\frac{0.5 \times 990}{6}=82.5$
$\text { Corrected } \Sigma d^2=82.5-(\text { False } d)^2+(\text { True } d)^2$
$=82.5-(3)^2+(7)^2$
$=82.5-9+49$
$=122.5$
Corrected rank correlation coefficient:
$r=1-\frac{6\left(\text { Corrected } \Sigma d^2\right)}{n\left(n^2-1\right)}$
Putting $n=10$ and corrected $\Sigma d^2=122.5$ in the formula.
$r=1-\frac{6(122.5)}{10\left(10^2-1\right)}$
$=1-\frac{735}{990}$
$=1-0.74$
$=0.26$
Hence, the corrected value of the coefficient of rank correlation obtained is $0.26.$
View full question & answer→Question 203 Marks
Ten contestants are ranked in a beauty contest by two judges and the sum of squares of differences in their ranks is found to be $214.$ Find the rank correlation coefficient.
AnswerHere, $n = 10; \sum d^2$
Now, $r=1-\frac{6\left(\Sigma d^2+ CF \right)}{n\left(n^2-1\right)}$
Putting $n = 10$ and $\sum d^2 = 214$ in the formula,
$r=1-\frac{6(214)}{10\left(10^2-1\right)}$
$=1-\frac{1284}{10(100-1)}$
$=1-\frac{1284}{990}$
$=1-1.30$
$=-0.30$
Hence, the rank correlation coefficient obtained is $– 0.30.$
View full question & answer→Question 213 Marks
Find the value of $r$ from the following data.
| Particulars |
$x$ |
$Y$ |
| Average |
$60$ |
$95$ |
| The sum of squares of deviations taken from their mean |
$920$ |
$1050$ |
| The sum of product of deviations taken from their mean |
$-545$ |
AnswerHere, $\bar{x}=60 ; \bar{y}=95 ; \Sigma(x-\bar{x})^2=920 ; \Sigma(y-\bar{y})^2=1050$ and $\Sigma(x-\bar{x})(y-\bar{y})=-545$.
Now, $\mathrm{r}=\frac{\Sigma(x-\bar{x})(y-\bar{y})}{\sqrt{\Sigma(x-\bar{x})^2} \cdot \sqrt{\Sigma(y-\bar{y})^2}}$
$=\frac{-545}{\sqrt{920} \cdot \sqrt{1050}}$
$ =\frac{-545}{\sqrt{966000}}=\frac{-545}{982.85}=-0.55$
Hence, the correlation coefficient obtained is $-0.55 .$
View full question & answer→Question 223 Marks
The following information is obtained regarding the height $(X)$ and weight $(Y)$ from a sample of ten students of a school:
$x̄ = 160, ȳ = 55, \sum xy = 90000, S_x = 25, S_y = 10$
Find the correlation coefficient between the height and weight from it.
AnswerHere, $n = 10; x̄ = 160; ȳ = 55; \sum xy = 90000; S_x = 25$ and $S_y = 10.$
Now, r =$\frac{\Sigma x y-n \bar{x} \bar{y}}{n \cdot S_{x} \cdot S_{y}}$
$= \frac{90000-10 \times 160 \times 55}{10 \times 25 \times 10}$
$=\frac{90000-88000}{2500}$
$= \frac{2000}{2500}$
$= 0.8$
Hence, the correlation coefficient between height and weight obtained is $0.8.$
View full question & answer→Question 233 Marks
Find the correlation coefficeint from the following information
AnswerHere $n =10, \operatorname{Cov}( x , y )=30, S_{ x }=5$, and $s_{ y }^2=144$
$\therefore s _{ y }=12 .$
$\therefore r=\frac{\operatorname{Cov}( x , y )}{s_{ x } \cdot s_y}=\frac{30}{5 \times 12}=\frac{30}{60}=0.5$
View full question & answer→Question 243 Marks
The sum of squares of difference of ranks for sales $(x)$ and profit $(y)$ of $8$ different companies is $6.$ In the data observation $25$ repeated twice, $59$ repeated twice and $65$ repeated thrice.Find rank correlation coefficient for this data.
View full question & answer→Question 253 Marks
The sum of squares of difference of ranks of marks obtained by $7$ students in reading $(x)$ and test $(y)$ is $2.5.$ One observation of marks obtained in the test one observation $75$ is repeated twice. Find the rank correlation coefficient from this data.
View full question & answer→Question 263 Marks
The sum of squares of differences of ranks for marks in Accountancy and Statistics of $8$ students is obtained $81.5.$ In the observations of marks of Accountancy marks $30$ is repeated thrice and in that Statistics marks $80$ is repeated twice. Find the rank correlation coefficient from this data.
View full question & answer→Question 273 Marks
If sum of squares of difference of ranks of $x$ and $y$ is $30$ and the rank correlation coefficient is $1/2 .-,$ find the number of pairs.
View full question & answer→Question 283 Marks
From the following data find the correlation coefficient between $X$ and $Y$ and interprete it: $ \begin{aligned} &n=7, \sum x=54, \sum y=538, \sum u=5, \sum v= \\ &13, \sum u^{2}=53, \sum v^{2}=469, \sum u v=-139 \end{aligned} $
Answer$r = -1,$ perfect negative linear correlation
View full question & answer→Question 293 Marks
In order to study the relation between profit $(X)$ and percentage of dividend $(Y)$ on share, the following information is obtained from a sample inquiry of $8$ companies: $ \sum(x-12)(y-15)-80, \sum(x-12)^{2}-400, \sum(y-15)^{2}-80(x- $ $ 13.5),(\bar{y}=16.5) $
View full question & answer→Question 303 Marks
If the Karl Pearson's coefficient of correlation between two varlables $X$ and $Y$ is $r=$ $\frac{1}{5}, S_{y}=4, \sum(x-x)(y-y)=36$ and, $(x-x)^{2}=225$ find the number of pairs $n$ of $X$ and $Y$.
View full question & answer→Question 313 Marks
If $r=0.8, \sum(x-\bar{x})(y-\bar{y})=60 S_{y}=2.5, \sum(x-\bar{x})^{2}-90$, find the number of pairs of $X$ and $Y$.
View full question & answer→Question 323 Marks
If $r=(X, Y)=0.5$, then find the comelation coefficient between $(1)-X$ and $-Y (2) - X$ and $Y (3) 2 X$ and $2 Y(4) 100-X$ and $Y (5)X$ and $50-Y$
Answer$(1) r=0.5 (2) r=0.5 (3) r=0.5 (4) r=-0.5 (5) r=-0.5$
View full question & answer→Question 333 Marks
The following results are obtained from a bivariate data, $n=10$, $\Sigma(x-\bar{x})(y-\bar{y})=72, S_x=3$, and $\Sigma(y-\bar{y})^2=360$, find the correlation coefficient.
AnswerFirst find $S_y = \sqrt{\frac{\Sigma(y-\bar{y})^2}{n}} = \sqrt{\frac{360}{10}} = 6$.
$r = \frac{\Sigma(x-\bar{x})(y-\bar{y})}{n \cdot S_x \cdot S_y} = \frac{72}{10 \cdot 3 \cdot 6} = \frac{72}{180} = 0.4$.
View full question & answer→Question 343 Marks
To know the relation between understanding of students in the subject of Mathematics and Statistics, a sample of eight students is taken and a test is considered for them. The marks obtained are given below. Find the rank correlation between the marks obtained in two subjects :
| Marks in Mathematics | 60 | 30 | 10 | 20 | 30 | 50 | 30 | 40 |
| Marks in Statistics | 80 | 20 | 60 | 40 | 12 | 28 | 20 | 15 |
Answer| Maths $(X)$ | Stats $(Y)$ | $R_x$ | $R_y$ | $d=R_x-R_y$ | $d^2$ |
| 60 | 80 | 1 | 1 | 0 | 0 |
| 30 | 20 | 5 | 5.5 | -0.5 | 0.25 |
| 10 | 60 | 8 | 2 | 6 | 36 |
| 20 | 40 | 7 | 3 | 4 | 16 |
| 30 | 12 | 5 | 8 | -3 | 9 |
| 50 | 28 | 2 | 4 | -2 | 4 |
| 30 | 20 | 5 | 5.5 | -0.5 | 0.25 |
| 40 | 15 | 3 | 7 | -4 | 16 |
| | | | | $\sum d^2=81.5$ |
$\left(30\right.$ repeats 3 times) : $\frac{3^3-3}{12}=2$
$(20$ repeats 2 times $) : \frac{2^3-2}{12}=0.5$
$r=1-\frac{6\left(\sum d^2+C F\right)}{n\left(n^2-1\right)}$
$=1-\frac{6(81.5+2.5)}{8(64-1)}=1-\frac{504}{504}=0$ View full question & answer→Question 353 Marks
The principal of a school has conducted a test for five students selected in a sample to judge the relation between the knowledge of mathematics and memory ability in the subject of History of the students. The ranks given to these five students in the subject of Mathematics and History are given below. Find the rank correlation coefficient between ranks of two subjects using this information :
| Students | A | B | C | D | E |
| Ranks in Mathematics | 2 | 5 | 1 | 4 | 3 |
| Ranks in History | 4 | 1 | 5 | 2 | 3 |
Answer| Student | Rank in Maths ( $R_x$ ) | Rank in History ( $R_y$ ) | $d=R_x-R_y$ | $d^2$ |
| A | 2 | 4 | -2 | 4 |
| B | 5 | 1 | 4 | 16 |
| C | 1 | 5 | -4 | 16 |
| D | 4 | 2 | 2 | 4 |
| E | 3 | 3 | 0 | 0 |
| | | | $\sum d=0$ | $\sum d^2=40$ |
$r=1-\frac{6 \sum d^2}{n\left(n^2-1\right)}$
$r=1-\frac{6(40)}{5\left(5^2-1\right)}$
$r=1-\frac{240}{5(25-1)}$
$r=1-\frac{240}{5(24)}$
$r=1-\frac{240}{120}$
$r=1-2$
$r=-1$
The rank correlation coefficient is -1 . This indicates a perfect negative correlation between the students' ranks in Mathematics and History.
View full question & answer→Question 363 Marks
n=10, $\overline{x}=120$, $\overline{y}=150.5$, $S_x=30$ $S_{y}=40$ and $\Sigma xy = 1,89,000$. Find the correlation coefficient given information.
Answer$r = \frac{\Sigma xy - n\bar{x}\bar{y}}{n \cdot S_x \cdot S_y}$
$r = \frac{189000 - (10 \times 120 \times 150.5)}{10 \times 30 \times 40}$
$r = \frac{189000 - 180600}{12000} = \frac{8400}{12000} = 0.7$.
View full question & answer→