Questions · Page 1 of 2

5 Mark Each

🎯

Test yourself on this topic

50 questions · timed · auto-graded

Question 15 Marks
To know the relation between the heights and weights of the students of a school, a sample of six students is taken and the following information is obtained. Find the correlation coefficient between the heights and weights of the students.
View full question & answer
Question 25 Marks
From the following information of weekly minimum temperature $($in Celsius$)$ and the sale $($in hundred units$)$ of heaters during a week in a city of North India for five weeks, calculate the correlation coefficient between minimum temperature and sale of heaters.
Answer
Here, $n=5, \quad \bar{x}=\frac{\Sigma x}{n}=\frac{29}{5}=5.8, \quad \bar{y}=\frac{\Sigma y}{n}=\frac{65}{5}=13$
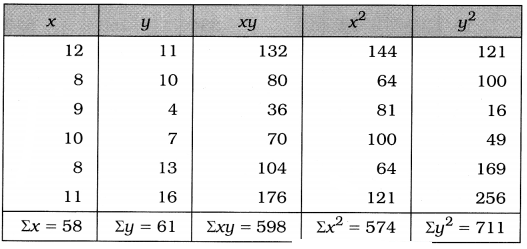
Since one of the means is fractional and the values of variables $X$ and $Y$ are not very large, we shall compute $r$ as follows.
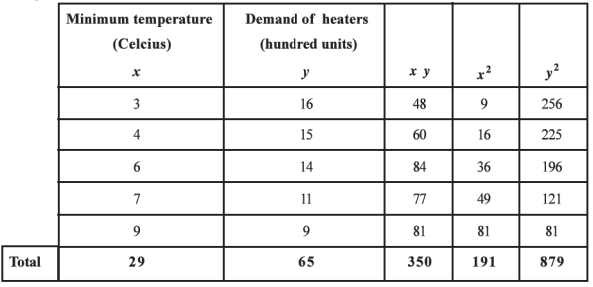
$ r =\frac{n \Sigma x y-(2 x)(2 y)}{\sqrt{n \Sigma x^{2}-(\Sigma x)^{2}} \cdot \sqrt{n \Sigma y^{2}-(\Sigma y)^{2}}}$
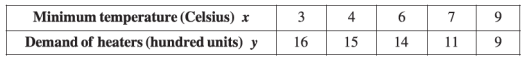
$ =\frac{5(350)-(29)(65)}{\sqrt{5(191)-(29)^{2}} \cdot \sqrt{5(879)-(65)^{2}}}$
$ =\frac{1750-1885}{\sqrt{955-841} \cdot \sqrt{4395-4225}}$
$ =\frac{-135}{\sqrt{114} \cdot \sqrt{170}}$
$ =\frac{-135}{\sqrt{19380}}$
$ =\frac{-135}{139.2121}$
$ =-0.9697$
$\therefore r \sim-0.97 $
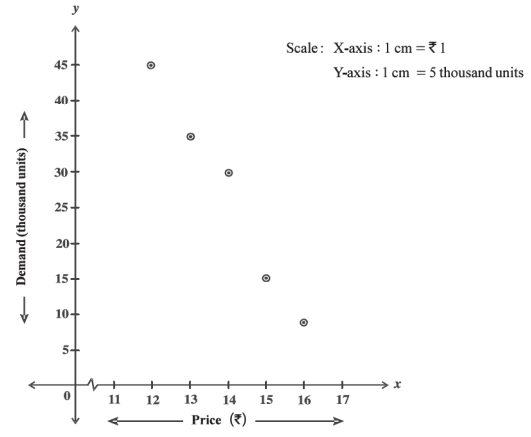
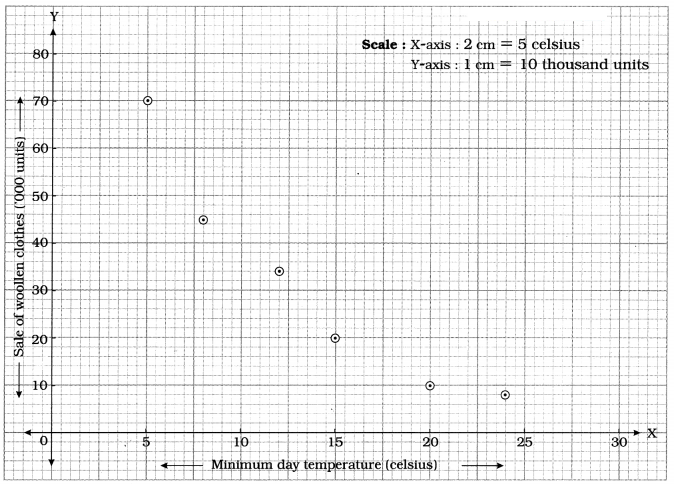
We can see that the value ofr is very close to $-1.$
Thus, there is a high degree of negative correlation between minimum temperature and $d$
emand of heaters.
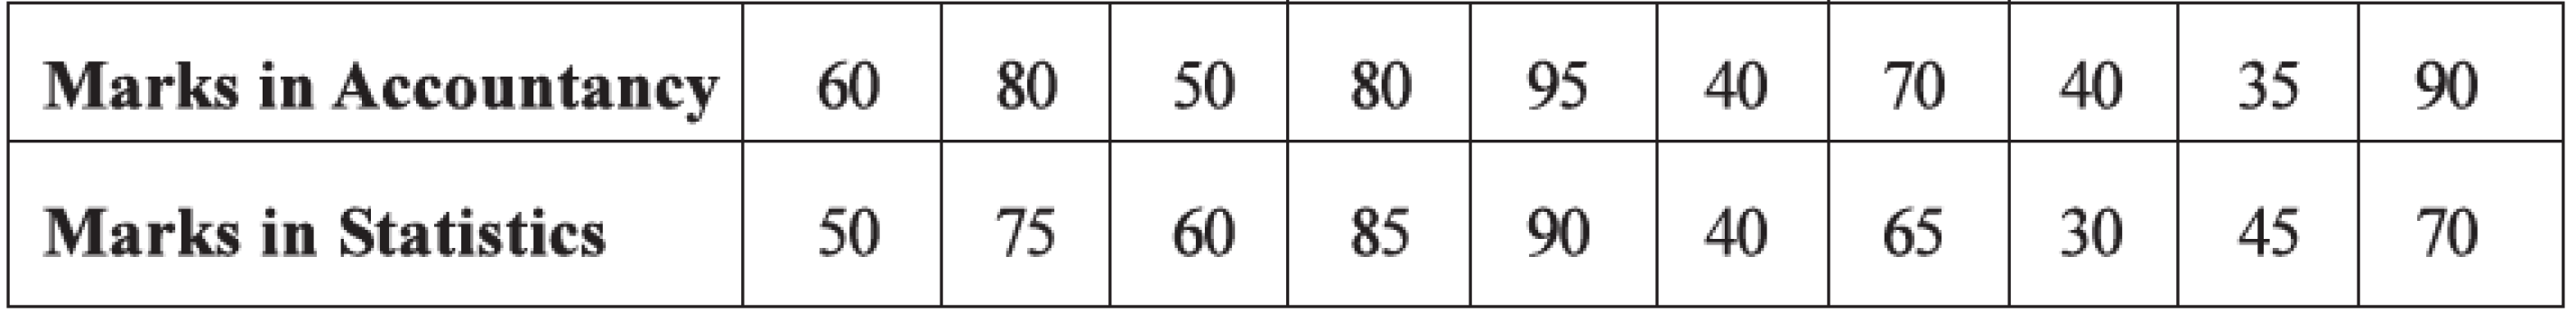
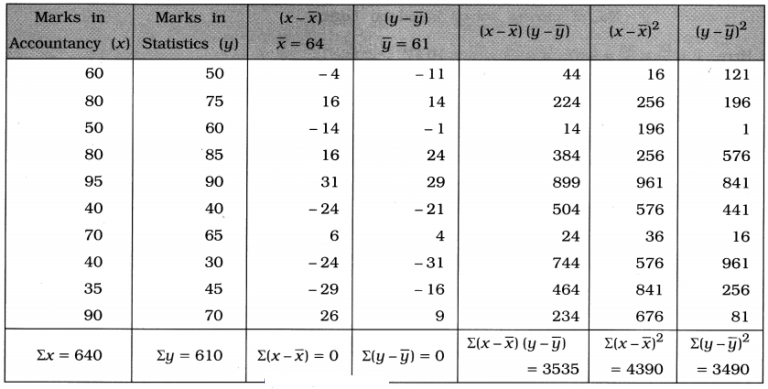
In illustrations $(7)$ and $(8),$ we have seen that both means were not integers and the values of $X$ and $Y$ were not very large and hence we have used the following formula to compute the value of $r.$
$r=\frac{n \Sigma x y-(\Sigma x)(\Sigma y)}{\sqrt{n \Sigma x^{2}-(\Sigma x)^{2}} \cdot \sqrt{n \Sigma y^{2}-(\Sigma y)^{2}}}$
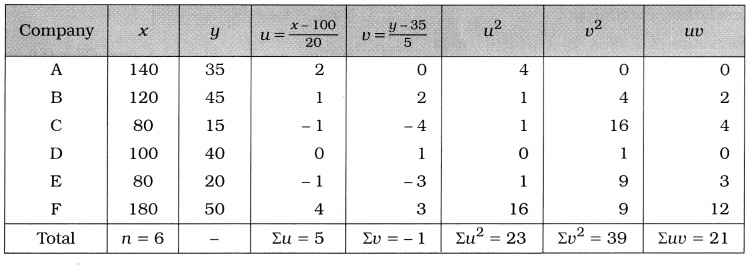
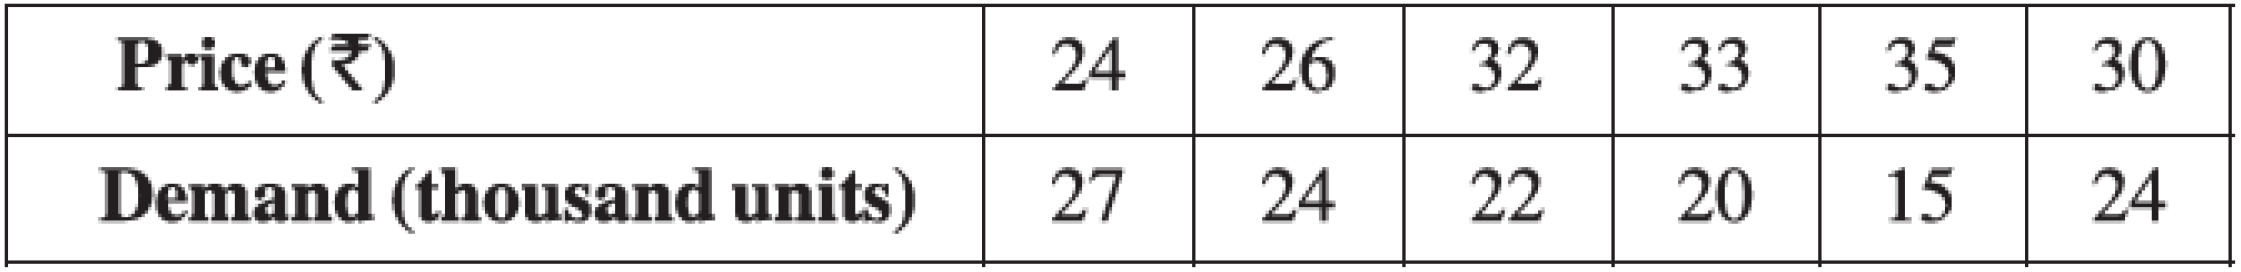
But when the values of two variables are numerically large and/or fractional, the computation of $x y, x^{2}, y^{2}$ becomes more difficult and hence the calculation of $r$ becomes tedius.
So, in order to make the computation of $r$ simple, a short-cut method is used. This short-cut method is based on the property $($No. $4)$ of $r$.
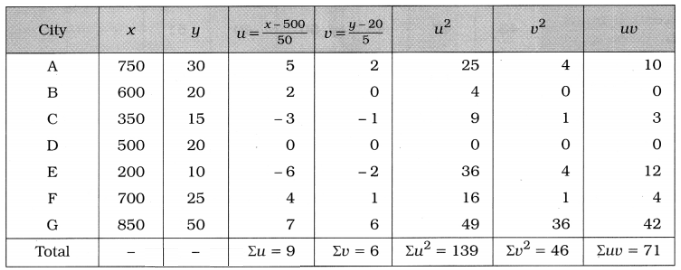
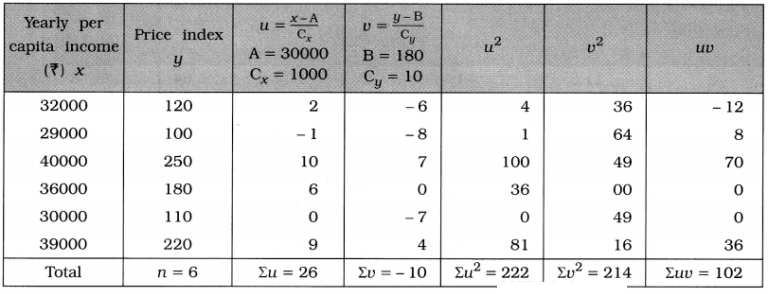
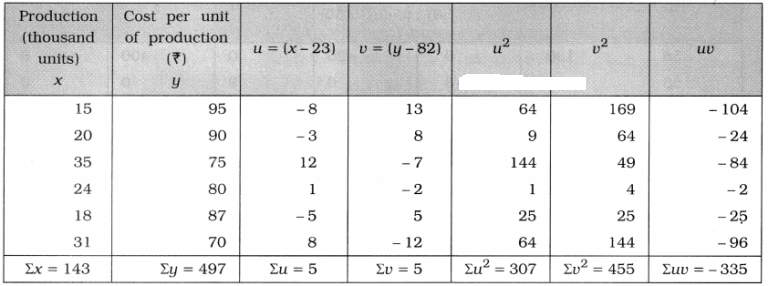
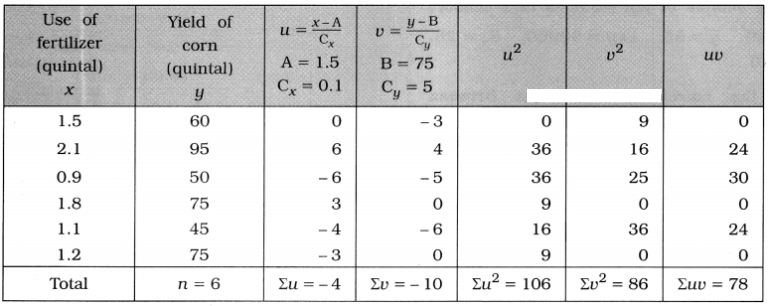
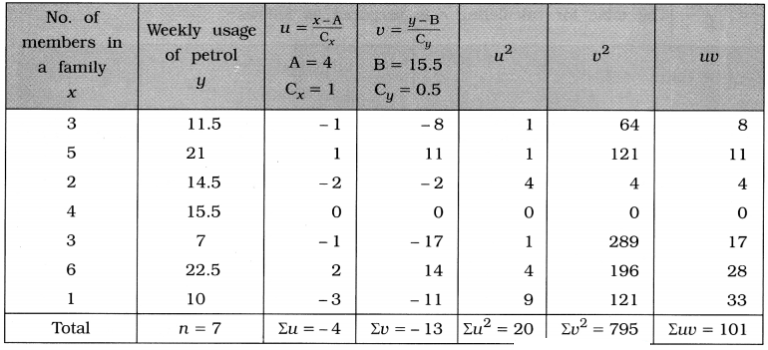
According to this property, replacing $x$ by $u$ and $y$ by $v$ in the formula of $r,$ we get the following formula of $r$ by short-cut method.
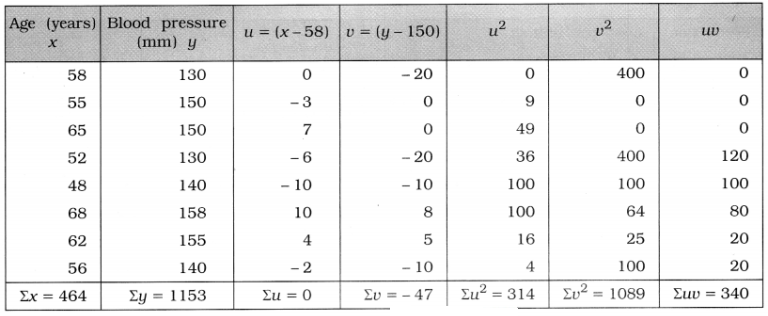
$r=\frac{n \Sigma u v-(\Sigma u)(\Sigma v)}{\sqrt{n \Sigma u^{2}-(\Sigma u)^{2}} \cdot \sqrt{n \Sigma v^{2}-(\Sigma v)^{2}}}$
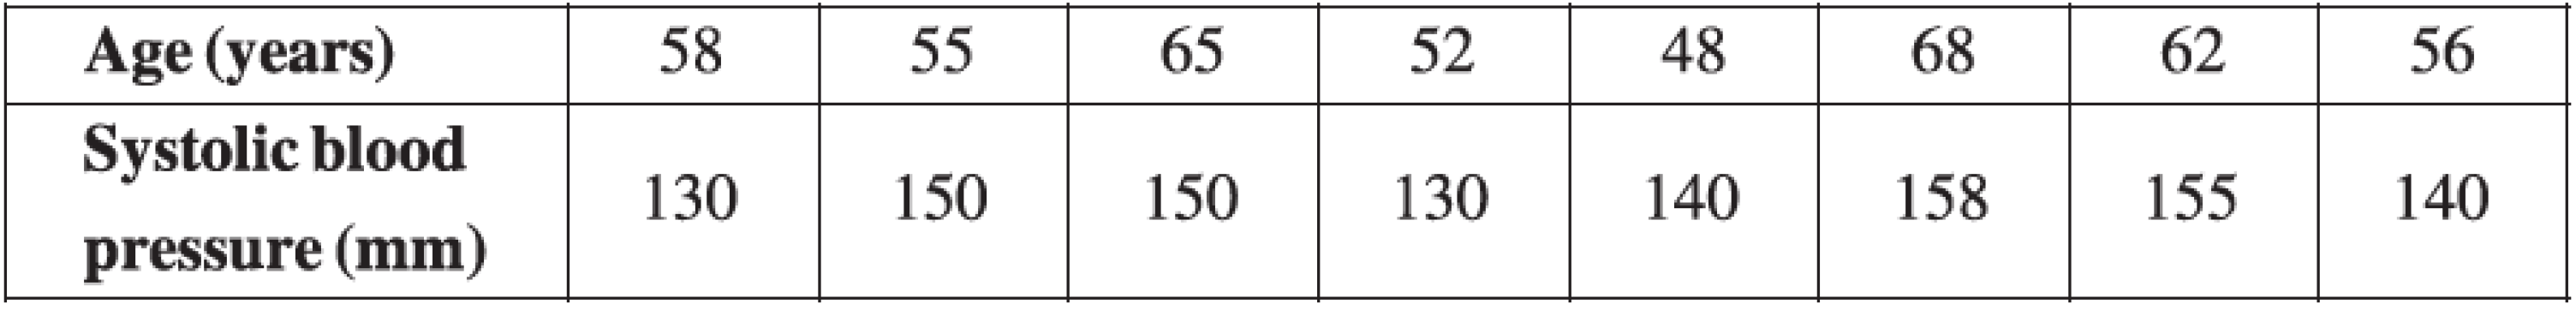
Now, we consider some examples to illustrate the computation of $r$ by the short-cut method.
View full question & answer
Question 35 Marks
The details of monthly sale of mobile phones $($in thousand units$)$ and its profit $($in lakh $₹)$ for the last six months for a company making mobile phones are given below.

Find the correlation coefficient between ‘number of mobile phones sold’ and its ‘profit’.
Answer
Here, $n=6,\bar{x}=\frac{\Sigma x}{n}=\frac{40}{6}=6.67,\bar{y}=\frac{\Sigma y}{n}=\frac{58}{6}=9.67$
Since the means $\bar{x}$ and $\bar{y}$ are fractional and the values of $X$ and $Y$ are not very large, we can compute $r$ as follows.

$ r =\frac{n \Sigma x y-(\Sigma x)(\Sigma y)}{\sqrt{n \Sigma x^{2}-(\Sigma x)^{2}} \cdot \sqrt{n \Sigma y^{2}-(\Sigma y)^{2}}}$
$ =\frac{6(431)-(40)(58)}{\sqrt{6(316)-(40)^{2}} \cdot \sqrt{6(606)-(58)^{2}}}$
$ =\frac{2586-2320}{\sqrt{1896-1600} \cdot \sqrt{3636-3364}}$
$ =\frac{266}{\sqrt{296} \cdot \sqrt{272}}$
$ =\frac{266}{\sqrt{80512}}$
$ =\frac{266}{283.7464}$
$ =0.9375$
$\therefore \simeq 0.94 $
We can see that the value of $r$ is close to $1.$
Thus, there is a high degree of positive correlation between sale of mobile phones and its profit.
View full question & answer
Question 45 Marks
In order to study the relation between the performance of students of a school in terms of marks in the subjects of Gujarati and Statistics, the following data are collected by taking a sample of six students.

Compute the correlation coefficient between the marks obtained by the students in two subjects from this data.
Answer
Here, $n=6,\bar{x}=\frac{\Sigma x}{n}=\frac{414}{6}=69,\bar{y}=\frac{\Sigma y}{n}=\frac{540}{6}=90$
Since both the means $\bar{x}$ and $\bar{y}$ are integers, we can obtain $r$ as follows.

$ r =\frac{\Sigma(x-\bar{x})(y-\bar{y})}{\sqrt{\Sigma(x-\bar{x})^{2}} \cdot \sqrt{\Sigma(y-\bar{y})^{2}}}$
$ =\frac{8}{\sqrt{44} \cdot \sqrt{58}}$
$ =\frac{8}{\sqrt{2552}}$
$ =\frac{8}{50.5173}$
$ =0.1584$
$\therefore r \simeq 0.16 $
We can see that the value of $r$ is close to $0.$
Thus, there is low degree of positive correlation between the marks of students in these two subjects.
View full question & answer
Question 55 Marks
The following information is collected by taking a sample of seven candidates having nearly same intellectual ability to know the effect of ‘last days preparation’ for a competitive examination of general knowledge on the ‘result of the examination’.
Find the correlation coefficient between reading hours of the last three days and marks obtained in the examination from the data and interpret it.
Answer
Here, $n=7$, mean for reading hours $(x)$ is $\bar{x}=\frac{\Sigma x}{n}=\frac{231}{7}=33$,
mean for marks $(y)$ is $\bar{y}=\frac{\Sigma y}{n}=\frac{504}{7}=72$
Since both the means $\bar{x}$ and $\bar{y}$ are integers, we can obtain $r$ as follows.

$ r =\frac{\Sigma(x-\bar{x})(y-\bar{y})}{\sqrt{\Sigma(x-\bar{x})^{2}} \cdot \sqrt{\Sigma(y-\bar{y})^{2}}}$
$ =\frac{151}{\sqrt{182} \cdot \sqrt{136}}$
$ =\frac{151}{\sqrt{182 \times 136}}$
$ =\frac{151}{\sqrt{24752}}$
$ =\frac{151}{157.3277}$
$ =0.9598$
$\therefore r \simeq 0.96 $
We can see that the value of $r$ is very near to $1.$
Thus, there is high degree of positive correlation between the reading hours and the marks.
Hence, it can be said that generally if last days reading hours are more then more marks can be obtained in the examination.
View full question & answer
Question 65 Marks
A company manufacturing spare parts for vehicles fixed different prices of rubber busher for five months to know the effect of price on its demand. Draw the scatter diagram from it and discuss about the nature of the correlation.
Answer
By plotting the points of ordered pairs $(12, 45), (13, 35), (14, 30), (15, 15), (16, 10)$ of two variables $x$ and $y$ on the graph paper, we get the scatter diagram as follows.

We can see that all the points do not lie on the same line in the scatter diagram.
The changes in price and demand are in opposite direction but they do not change in same proportion.
Hence, all points are not on the same line.
So, we can say that there is a partial negative correlation between $X$ and $Y.$
Note : If the points are nearer to a line, it indicates high degree of correlation and if the points are widely spread around a line, it indicates low degree of correlation.
View full question & answer
Question 75 Marks
A company manufactures readymade garments. The monthly advertisement cost $($in ten lakh $₹)$ and the sale of garments $($in crore $₹)$ for the last six months are given below :

Draw a scatter diagram from the data and discuss about the correlation.
Answer
The following scatter diagram is obtained by plotting the points of ordered pairs $(5, 20), (8, 30), (10,50), (15, 70), (12, 60)$ and $(9, 35)$ of two variable $X$ and $Y$ on the graph paper.

We can see that all points on the scatter diagram do not lie on the same line.
The changes in advertisement cost and sales are in the same direction but not in the same proportion.
Hence, all the points are not on the same line.
So. we can say that there is a partial positive correlation between $X$ and $Y.$
View full question & answer
Question 85 Marks
An agency marketing electrical appliances wants to know the relation between the sales and the profits of $LED$ fittings. The following information is obtained about the sales and profits of different electric companies. Find the rank correlation coefficient between the sales $($in thousand units$)$ and the profits $($in lakh $₹)$
Answer
Here, $n - 8$ and the observations $25$ and $58$ in sales are given twice and the observation $65$ in profit is given thrice.
So, assigning the ranks to both the variables, sales and profit, in the same manner as discussed in the previous example, we prepare a table as follows.
View full question & answer
Question 95 Marks
To know the relation between understanding of students in the subject of Economics and their dancing skill, a sample of eight students is taken and a test is conducted for them. The marks obtained are given below. Find the rank correlation coefficient between the marks ob- tained in two subjects.
Answer
If we assign ranks according to the marks in Economics then the highest marks is $60 .$
So, its rank is $1 ,$ rank $2$ for the marks $50$ and rank $3$ for the marks $40 .$
Now, the next is marks 30 which is repeated three times.
So, the average rank of the corresponding ranks $($rank $4 ,$ rank $5 ,$ rank $6)$ i.e. $\frac{4+5+6}{3}=5$ will be the rank for the marks $30 .$
Now, after mark $30 ,$ it is marks $20 .$ So, its rank will be $7$ and finally for the lowest marks $10 ,$ its rank will be $8.$
Similarly, if we assign ranks according to the marks in dancing skill then the highest marks is $80 .$
So, its rank will be $1 ,$ rank $2$ for marks $60 ,$ rank $3$ for marks $40 ,$ rank $4$ for marks $28 .$
Now, marks $20$ is repeated two times. So, the average rank of the corresponding ranks $($rank $5,$ rank $6)$ i.e. $\frac{5+6}{2}=5.5$ will be the rank for the marks $20 .$
Now, next is marks $15 ,$ so its rank will be $7$ and finally the lowest marks $12$ will have rank $8 .$
Now, let us prepare a table as follows.

Here, $r - 0.$ So, it can be said that there is a lack of linear correlation between the ranks of the marks in both the subjects.
i.e. the performances ofthe students ofthe given group in the subjects ofliconomics and dancing skill are independent with reference to the linear relationship.
View full question & answer
Question 105 Marks
Calculate the rank correlation coefficient using the data given in illustration $5.$
Answer
We shall assign the ranks to both the variables as per our earlier discussion.The observation $75$ for the variable $Y$ is repeated two times. The highest observation is $79 .$ So, after assigning the rank $1$ to it, we shall assign the average rank of rank $2$ and rank $3.$ i.e. $\frac{2+3}{2}=2.5$ to each of the following observation $75 .$
View full question & answer
Question 115 Marks
To know the relation between monthly expenditure and monthly savings for middle class families, the information regarding expenditure and savings for $5$ families is given below. $($The monthly income of each family is $₹ 20,000)$
​​​​​​​Draw a scatter diagram indicating the relation between monthly expenditure and monthly savings from this information and discuss about their correlation.
Answer
The following scatter diagram is obtained by plotting the points of ordered pairs $(15, 5), (18, 2), (8,12), (10,10), (12, 8)$ of $X$ and $Y$ on the graph paper.

We can see that all the points on the scatter diagram, lie on the same line. We can also see that as the values of variable $X$ change, the values of variable $Y$ also change in opposite direction in constant proportion.$($Check that the salary is fixed here for given five months, so the increase $($or decrease$)$ in the monthly expenditure results in constant propotionate decrease $($or increase$)$ in the monthly savings$.)$ So, we can say that there is a perfect negative correlation between $X$ and $Y.$
View full question & answer
Question 125 Marks
In order to study the relation between the sales $($in erore $?)$ and the profit $($in thousand $?)$ for truck tyre manufacturing companies, the following information is obtained for the last year.
Find the correlation coefficient between the sales and the profit from it.
View full question & answer
Question 135 Marks
For six different cities of Gujarat State, the approximate figures regarding their density of population $($per square km$)$ and the death rate $($per thousand$)$ are given below.

Find the correlation coefficient between the density ofpopulation and death rate from this information.
View full question & answer
Question 145 Marks
To know the relation between the average monthly income $($in $₹)$ and income due to overtime of workers $($in $₹),$ the following information is obtained from six different factories of an area manufacturing similar kind of products. Find the correlation coefficient between the average monthly income and income due to overtime.
View full question & answer
Question 155 Marks
After standard deduction from total income, $20".;$ income tax is imposed on the remaining income. The information regarding the taxable income and the tax to be paid is given below for five persons.

Draw a scatter diagram from this information and discuss about the correlation.
Answer
The following scatter diagram is obtained by plotting the points corresponding to the ordered pairs $(50, 10), (30, 6),(80, 16), (20, 4)$ and $(100,20)$ of $x$ and $y.$

We can see that all the points lie on the same line in the scatter diagram.
We can also see that as the values of variable $X$ Change, the values of variable $Y$ also change in the same direction with a constant proportion. $($Check that when the value of variable $X$ is multiplied by $0.2 (20\%),$ the corresponding value of variable $Y$ of the ordered pair is obtained. So, the changes in the two variables $X$ and $Y$ are in same proportion.$)$
Hence, we can say that there is a perfect positive correlation between two variables $X$ and $Y.$
View full question & answer
Question 165 Marks
The following data is obtained for two variables, inflation $(X)$ and interest rate $(Y) :$
$n = 50, \sum x = 500, \sum y = 300, \sum x^2 = 5450, \sum y^2 = 2000, \sum xy = 3090$
Later on, it was known that one pair of observation $(10, 6)$ was included additionally by mistake. Find the correlation coefficient by excluding this pair of observations.
Answer
Here, $n – 50; \sum x = 500; \sum y = 300; \sum x^2 = 5450; \sum y^2 = 2000$ and $\sum xy = 3090$
A pair of observation $(10, 6)$ is to be deleted.
We find the corrected values as shown in the following table :
Image

Putting all these corrected value in the following formula, we get
$r=\frac{n \Sigma x y-(\Sigma x)(\Sigma y)}{\sqrt{n \Sigma x^2-(\Sigma x)^2} \cdot \sqrt{n \Sigma y^2-(\Sigma y)^2}}$
$=\frac{49(3030)-(490)(294)}{\sqrt{49 \times 5350-(490)^2} \cdot \sqrt{49 \times 1964-(294)^2}}$
$=\frac{148470-144060}{\sqrt{262150-240100} \cdot \sqrt{96236-86436}}$
$=\frac{4410}{\sqrt{22050} \cdot \sqrt{9800}}$
$=\frac{4410}{\sqrt{216090000}}$
$=\frac{4410}{14700}$
$=0.3$
Hence, the correlation coefficient obtained is $0.3 .$
View full question & answer
Question 175 Marks
Six dancers $A, B, C, D, E,$ and $F$ in dance competition were judged by two dance Gurus. The ranks assigned to the dancers are as follows.
Rank $1$ $2$ $3$ $4$ $5$ $6$
By Guru $1$ $B$ $F$ $A$ $C$ $D$ $E$
By Guru $2$ $F$ $A$ $C$ $B$ $E$ $D$
Find the rank correlation coefficient between the judgement of the two Gurus.
Answer
Here, $n = 6; R_x$ = Rank by Guru $1$ and $R_y= $ Rank by Guru $2.$
The table for calculating the rank correlation coefficient is prepared as follows :
Image
Rank correlation coefficient :
Now, $r=1-\frac{6\left(\Sigma d^2+\mathrm{CF}\right)}{n\left(n^2-1\right)}$
Putting $n=6, \Sigma d^2=14$ in the formula,
$r=1-\frac{6(14)}{6\left(6^2-1\right)}$
$ =1-\frac{84}{6(36-1)}$
$ =1-\frac{84}{210}$
$ =1-0.4$
$ =0.6$
View full question & answer
Question 185 Marks
An entrance test required to study abroad is conducted online. The marks obtained in Reasoning Ability and English Speaking in this online test $($having negative marking system for wrong answer$)$ by $5$ students selected in a sample are given below :
Student $A$ $B$ $C$ $D$ $E$
Marks in Reasoning Ability $5$ $5$ $5$ $5$ $5$
Marks in English Speaking $2$ $-2$ $-2$ $0$ $2$
Find the rank correlation coefficient between Reasoning Ability and Ability in English Speaking.
Answer
Here, $n = 5; x =$ Marks in Reasoning Ability and
$y =$ Marks in English Speaking
$R_x  =$ Ranks for $x$ and
$R_y =$ Ranks for $y.$
The table for calculating the rank correlation coefficient is prepared as follows :Image
Rank correlation coefficient: Here, observation $5$ of variable $x$ is repeated for five times and to $y, 2$ is repeated twice and $– 2$ is repeated twice.
So the $CF$ is calculated as follows :
Image
Now, $r=1-\frac{6\left(\Sigma d^2+\mathrm{CF}\right)}{n\left(n^2-1\right)}$
Putting $n=5, \Sigma d^2=9$ and $C F=11$ in the formula,
$r=1-\frac{6(9+11)}{5\left(5^2-1\right)}$
$=1-\frac{6(20)}{5(25-1)}$
$=1-\frac{120}{120}$
$=1-1$
$=0$
Hence, the rank correlation coefficient between the judgement of the two Gurus obtained is $0.6.$
View full question & answer
Question 195 Marks
The following data is obtained to know the relation between maximum day temperature and the sale of ice-cream in Ahmedabad city.
Maximum Temperature $($Celsius$)$ $35$ $42$ $40$ $39$ $44$ $40$ $45$ $40$
Weight of child $(kg)$ $600$ $680$ $750$ $630$ $920$ $750$ $900$ $720$
Calculate the rank correlation coefficient.
Answer
Here, $n = 8; x =$ Maximum temperature; $y =$ Sale of ice cream
$R_x =$ Ranks for $x$ and $R_y =$ Ranks for $y$
The table for calculating the rank correlation coefficient is prepared as follows :Image
Rank correlation coefficient :
Here, observation $40$ on $x$ is repeated thrice and $750$ of $y$ is repeated twice.
So $CF$ is calculated as follows :
Image
Now, $r=1-\frac{6\left(\Sigma d^2+\mathrm{CF}\right)}{n\left(n^2-1\right)}$
Putting $n=8, \Sigma d^2=15.5$ and $C F=2.5$ in the formula,
$r=1-\frac{6(15.5+2.5)}{8\left(8^2-1\right)}$
$=1-\frac{6(18)}{8(64-1)}$
$=1-\frac{108}{504}$
$=1-0.21$
$=0.79$
Hence, the rank correlation coefficient between maximum temperature and sale of ice cream obtained is $0.79.$
View full question & answer
Question 205 Marks
A doctor obtains the following information for the weights of seven mothers and their children from a maternity home for his research to know the relation between the weights of mother and weights of their children at the time of birth.
Weight of mother $(kg)$ $59$ $72$ $66$ $64$ $77$ $66$ $60$
Weight of child $(kg)$ $2.5$ $3.4$ $3.1$ $2.7$ $2.8$ $2.3$ $3.0$
Find the rank correlation between the weights of mother and child.
Answer
Here, $n = 7; x =$ Weight of mother; $y =$ Weight of child
$R_x =$ Rank of weight of mother, $R_y = $ Rank of weight of child
The table for calculating the rank correlation coefficient is prepared as follows :
Image
Rank correlation coefficient:
Here, observation $66$ of $x$ is repeated twice.
So $CF$ is calculated as follows :
Image

Now, $r=1-\frac{6\left(\Sigma d^2+\mathrm{CF}\right)}{n\left(n^2-1\right)}$
Putting $n=7, \Sigma \mathrm{d}^2=34.5$ and $C F=0.5$ in the formula,
$r=1-\frac{6(34.5+0.5)}{7\left(7^2-1\right)}$
$=1-\frac{6(35)}{7(49-1)}$
$=1-\frac{210}{336}$
$=1-0.62$
$=0.38$
Hence, the rank correlation coefficient between the weights of mother and child obtained is $0.38.$
View full question & answer
Question 215 Marks
The following information is obtained to study the relationship between the advertisement cost and the sales of electric fans of the companies manufacturing electric fans. Find the correlation coefficient between advertisement cost and the sales by Karl Pearson’s method :
Image
Answer
Here, $n = 6; x =$ Advertisement cost;
$y =$ Sales of electric fans We calculate $r$ by shortcut method obtaining new variables
$u =\frac{x- A }{ C _x}$$=\frac{x-100}{20}$ and $v =\frac{y- B }{ C _y}=\frac{y-35}{5}$
Image
Karl Pearson’s correlation coefficient :
Now, $r =\frac{n \Sigma u v-(\Sigma u)(\Sigma v)}{\sqrt{n \Sigma u^2-(\Sigma u)^2} \cdot \sqrt{n \Sigma v^2-(\Sigma v)^2}}$
Putting $n = 6, \sum uv= 21, \sum u = 5, \sum v = – 1, \sum u^2 = 23$ and $\sum v^2 = 39$ in the formula,
$r=\frac{6(21)-(5)(-1)}{\sqrt{6 \times 23-(5)^2} \cdot \sqrt{6 \times 39-(-1)^2}}$
$=\frac{126+5}{\sqrt{138-25} \cdot \sqrt{234-1}}$
$=\frac{131}{\sqrt{113} \cdot \sqrt{233}}$
$=\frac{131}{\sqrt{26329}}$
$=\frac{131}{162.26}$
Hence, the correlation coefficient between advertisement cost and the sales of electrics fans obtained is $0.81.$
View full question & answer
Question 225 Marks
Find the Karl Pearson’s correlation coefficient between density of population $($per square km$)$ and death rate $($per thousand$)$ from the following data.
City $A$ $B$ $C$ $D$ $E$ $F$ $G$
Density $($per sq. km$)$ $750$ $600$ $350$ $500$ $200$ $700$ $850$
Death rate $($per thousand$)$ $30$ $20$ $15$ $20$ $10$ $25$ $50$
Answer
Here, $n = 7: x =$ Density, $y =$ Death rate.
We calculate the correlation coefficient by shortcut method obtaining new variables $u$ and $v$ and the table for calculation is prepared as follows :Image
Karl Pearson's correlation coefficient:
Now, $\mathrm{r}=\frac{n \Sigma u v-(\Sigma u)(\Sigma v)}{\sqrt{n \Sigma u^2-(\Sigma u)^2} \cdot \sqrt{n \Sigma v^2-(\Sigma v)^2}}$
Putting $n=7, \Sigma u v=71, \Sigma u=9, \Sigma v=6, \Sigma u^2=139$ and $\Sigma v^2=46$ in the formula,
$r =\frac{7 \times 71-(9)(6)}{\sqrt{7 \times 139-(9)^2} \cdot \sqrt{7 \times 46-(6)^2}}$
$ =\frac{497-54}{\sqrt{973-81} \cdot \sqrt{322-36}} \quad$
$ =\frac{443}{\sqrt{892} \cdot \sqrt{286}}=\frac{443}{\sqrt{255112}}=\frac{443}{505.09}=0.88$
Hence, Karl Pearson's correlation coefficient between density of population and death rate obtained is $0.88 .$
View full question & answer
Question 235 Marks
Find the Karl Pearson’s correlation coefficient from the following information of the average weekly hours spent on Video games and the grade point obtained in an examination by $6$ children of a big city.
Weekly average hours spent for Video games $43$ $47$ $45$ $50$ $40$ $51$
Grade points obtained in an examination $5.2$ $4.9$ $5.0$ $4.7$ $5.4$ $4.3$
Calculate the correlation coefficient by Karl Pearson’s method.
Answer
Here, Let $X = $ Weekly average hours spent for video games and
$Y = $Grade points obtained in an examination.
As the observations of both the variables are large also means $\bar y$ and y of variables is in the fraction,
we prepare the calculative table as under :
$X$ $y$ $u = x – A
A = 46$
$v = \frac{y-B}{c_y}
B = 49, Cy = 0.1$
$uv$ $u^2$ $v^2$
$43$ $5.2$ $-3$ $3$ $-9$ $9$ $9$
$47$ $4.9$ $1$ $0$ $0$ $1$ $0$
$45$ $5.0$ $-1$ $1$ $-1$ $1$ $1$
$50$ $4.7$ $4$ $-2$ $-8$ $16$ $4$
$40$ $5.4$ $-6$ $5$ $-30$ $36$ $25$
$51$ $4.3$ $5$ $-6$ $-30$ $25$ $36$
$\Sigma x$ = 276 $\Sigma y$ = 29.5 $\Sigma u$ = 0 $\Sigma v$ = 1 $\Sigma uv$ = -78 $\sum u^2$ = 88 $\sum v^2$ = 75
$\bar{x}^2=\frac{\sum x }{ n }=\frac{276}{6}=46 \text { and } \bar{y}_{=} \frac{\sum y }{ n }=\frac{29.5}{6}=4.92$
$\therefore r =\frac{n \sum u v-\left(\sum u\right)\left(\sum v\right)}{\sqrt{n \sum u^2-\left(\sum u\right)^2} \times \sqrt{n \sum v^2-\left(\sum v\right)^2}}$
$=\frac{6(-78)-(0)(1)}{\sqrt{6(88)-(0)^2} \times \sqrt{6(75)-(1)^2}}$
$=\frac{468-0}{\sqrt{528-0} \times \sqrt{450-1}}$
$=\frac{-468}{\sqrt{528} \times \sqrt{449}}$
$=\frac{-468}{\sqrt{237072}}=\frac{-468}{486.90}$
$=-0.9612$
$\therefore r=-0.96$
Hence, correlation coefficient between weekly average hours spent for video games and grade point obtained in an examination is $-0.96.$
View full question & answer
Question 245 Marks
The information of health index $x$ and life expectancy $y$ is obtained for $10$ people. These data are ranked to find the rank correlation coefficient and the sum of squares of the ranks was found to be $42.5$. It was also observed that health index $70$ was repeated three times and life expectancy $45$ was repeated twice in the data. Find the rank correlation coefficient using this information.
Answer
Here, $n = 10; \sum d^2 = 42.5, x =$ Health index and
$y =$ Life expectancy
$x = 70$ repeated thrice, $y = 45$ repeated twice.
We calculate $CF$ as follows :

Now, $r = 1 – \frac{6\left(\sum d^{2}+\mathrm{CF}\right)}{n\left(n^{2}-1\right)}$
Putting $n = 10, \sum d^2 = 42.5, CF = 2.5$ in the formula,
$r = 1 – \frac{6(42.5+2.5)}{10\left(10^{2}-1\right)}$
$= 1 – \frac{6(45)}{10(100-1)}$
$= 1 – \frac{270}{990}$
$= 1 – 0.27$
$= 0.73$
Hence, the rank correlation coefficient obtained is $0.73.$
View full question & answer
Question 255 Marks
Daily calorie intake of ten persons is $X$ and their weight is $Y \ kg$. The rank correlation coefficient from this information is $0.6 $. On subsequent verification, it was noticed that the difference of ranks of $X$ and $Y$ for one of the persons was taken as $2$ instead of $4.$ Find the correct value of rank correlation coefficient.
Answer
Here, $n = 10, r = 0.6$
Correct difference of ranks $d = 4$
Wrong difference of ranks $d = 2$
Now, $r = 1 – \frac{6 \Sigma d^{2}}{n\left(n^{2}-1\right)}$
$\therefore 0.6 = 1 – \frac{6 \Sigma d^{2}}{10\left(10^{2}-1\right)}$
$\therefore 0.6 – 1 = \frac{6 \Sigma d^{2}}{10(100-1)}$
$\therefore – 0.4 = – \frac{6 \Sigma d^{2}}{990}$
$\therefore 6\sum d^2 = 0.4 \times 990 = 396$
$\therefore \sum d^2 =\frac{396}{6} = 66$
Correct $\sum d^2 = 66 – (\text{wrong d})^2 + (\text{correct d})^2$
$= 66 – (2)^2 + (4)^2$
$= 66 – 4 + 16$
$= 78$
Hence, the Corrected value of rank correlation coefficient obtained is $0.53.$
Corrected value of rank correlation coefficient :
$r = 1 – \frac{6(\text { corrected }) \Sigma d^{2}}{n\left(n^{2}-1\right)}$
$= 1 – \frac{6(78)}{10\left(10^{2}-1\right)}$
$= 1 – \frac{468}{10(100-1)}$
$= 1 – \frac{468}{990}$
$= 1 – 0.47$
$= 0.53$
View full question & answer
Question 265 Marks
The information regarding sales $(X)$ and expenses $(Y)$ of $10$ firms is given below:
$x̄ = 58, ȳ = 14, \sum (x – 65)^2 = 850,$
$\sum (y – 13)^2 = 32, \sum (x – 65) (y – 13) = 0$
Find the correlation coefficient.
Answer
Here, $h=10 ; \bar{x}=58 ; \bar{y}=14, \Sigma(x-65)^2=850, \Sigma(y-13)^2=32, \Sigma(x-65)(y-13)=0$,
$\overline{\mathrm{x}}=58 \therefore u=\mathrm{u}-65$
$ \therefore \Sigma u=\Sigma_1^{10} x-\Sigma_1^{10} 65$
$ =n \bar{x}-650$
$ =(10 \times 58)-650$
$ =580-650=-70$
$ \bar{y}=14 \therefore v=y-13$
$ \therefore \Sigma v=\Sigma_1^{10} y-\Sigma_1^{10} 13$
$ =n \bar{y}-130$
$ =(10 \times 14)-130$
$ =140-130=10$
$ \Sigma u^2=\Sigma(x-65)^2=850$
$ \Sigma v^2=\Sigma(y-13)^2=32$
$ \Sigma u v=\Sigma(x-65)(y-13)=0$
$ n=10$
Now, $ r=\frac{n \Sigma u v-(\Sigma u)(\Sigma v)}{\sqrt{n \Sigma u^2-(\Sigma u)^2} \cdot \sqrt{n \Sigma v^2-(\Sigma v)^2}}$
Putting the above values in the formula,
$r =\frac{10(0)-(-70)(10)}{\sqrt{10 \times 850-(-70)^2} \cdot \sqrt{10 \times 32-(10)^2}}$
$ =\frac{0+700}{\sqrt{8500-4900} \cdot \sqrt{320-100}}$
$ =\frac{700}{\sqrt{3600 \cdot \sqrt{220}}}$
$ =\frac{700}{\sqrt{792000}} \quad$
$ =\frac{700}{889.94}$
$ =0.79$
Hence, the correlation coefficient obtained is $0.79 .$
View full question & answer
Question 275 Marks
The information to fertilizer used $($in tons$)$ and productivity $($in tons$)$ of eight district is given below :
Fertilizer $($tons$)$ $15$ $18$ $20$ $25$ $29$ $35$ $40$ $38$
Productivity $($tons$)$ $85$ $93$ $95$ $105$ $115$ $130$ $140$ $145$
Calculate the correction coefficient by Karl Pearson’s method
Answer
Here, $\mathrm{n}=8 ; \mathrm{x}=$ Fertilizer; $\mathrm{y}=$ Productivity
Now, $\overline{\mathrm{x}}=\frac{\Sigma x}{n}=\frac{220}{8}=27.5$ tons; $\overline{\mathrm{y}}=\frac{\Sigma y}{n}=\frac{908}{8}=113.5$ tons
$\bar{x}$ and $\bar{y}$ are not integers and the values of $x$ and $y$ are large. So we calculate $r$ by shortcut method.
We obtain new variables $u=x-A, A=27$ and $v=y-B, B=113$.
The table for calculating $r$ is prepared as follows :Image
Now, $\mathrm{r}=\frac{n \Sigma u v-(\Sigma u)(\Sigma v)}{\sqrt{n \Sigma u^2-(\Sigma u)^2} \cdot \sqrt{n \Sigma v^2-(\Sigma v)^2}}$
Putting $n=8, \Sigma u v=1501, \Sigma \mathrm{u}=4, \Sigma \mathrm{v}=4, \Sigma \mathrm{u}^2=636$ and $\Sigma \mathrm{v}^2=3618$ in the formula,
$r =\frac{8 \times 1501-(4)(4)}{\sqrt{8 \times 636-(4)^2 \cdot \sqrt{8 \times 3618-(4)^2}}}$
$ =\frac{12008-16}{\sqrt{5088-16 \cdot \sqrt{28944-16}}}$
$ =\frac{11992}{\sqrt{5072 \cdot \sqrt{28928}}} \quad$
$ =\frac{11992}{\sqrt{146722816}}$
$ =\frac{11992}{12112.92}$
$ =0.99$
Hence, the correlation coefficient by Karl Pearson's method obtained is $0.99 .$
View full question & answer
Question 285 Marks
Two interviewers gave the following scores to the candidates on the basis of their performance in the interview. Find the rank correlation coefficient between the evaluation of two interviewers:
Answer
Here, $n = 8: R_x =$ Ranks for marks by first interviewer $(x)$ and
$R_y$ = Ranks for marks by second interviewer $(y).$
The table for calculating rank correlation coefficient is prepared as follows:

Rank correlation coefficient:
Here, one observation $28$ of $x$ is repeated twice and one observation $32$ of $y$ is repeated thrice.
We calculate $CF$ as follows:
Now, $r = 1 –\frac{6\left(\Sigma d^{2}+\mathrm{CF}\right)}{n\left(n^{2}-1\right)}$
Putting $n = 8, \sum d^2 = 5.50$ and $CF = 2.5$ in the formula,
$r = 1 – \frac{6(5.50+2.50)}{8\left(8^{2}-1\right)}$
$= 1 – \frac{6(8)}{8(64-1)}$
$= 1 – \frac{48}{504}$
$= 1 – 0.10$
$= 0.90$
Hence, the rank correlation coefficient between the evaluation of two interviewers obtained is $0.90.$
View full question & answer
Question 295 Marks
From the following information of heights of husband and wife, calculate the rank correlation coefficient between their heights:
Answer
Here, $n = 7; R_x$ = Ranks for height of husband $(x)$ and $R_y =$ Ranks for height of wife $(y).$
The table for calculating rank correlation coefficient is prepared as follows:

Rank correlation coefficient:
Here, two observations $16.2$ and $154$ of the variable y are repeated twice.
So correction factor $CF$ is calculated as follows:
Now, $ r = 1 – \frac{6\left(\Sigma d^{2}+\mathrm{CF}\right)}{n\left(n^{2}-1\right)}$
Putting $n = 7; \sum d^2 = 4$ and $CF = 1$ in the formula,
$r = 1 –\frac{6(4+1)}{7\left(7^{2}-1\right)}$
$= 1 –\frac{6(5)}{7(49-1)}$
$= 1 – \frac{30}{336}$
$= 1 – 0.09$
$= 0.91$
Hence, the rank correlation coefficient between the heights of husband and wife is obtained $0.91.$
View full question & answer
Question 305 Marks
The following information is obtained by taking a sample of ten students from the students of a Science college:

Find the rank correlation coefficient between the ability of the students in the subjects of Mathematics and Statistics.
Answer
Here, $n = 10;R_x =$ Ranks for marks in Mathematics $(x)$ and $R_y =$ Ranks for marks in Statistics $(y).$
The table for calculating rank correlation coefficient is prepared as follows:

Rank correlation coefficient: $r = 1 – \frac{6 \Sigma d^{2}}{n\left(n^{2}-1\right)}$
Putting $n = 10$ and $\sum d^2 = 30$ in the formula,
$r = 1 – \frac{6(30)}{10\left(10^{2}-1\right)}$
$= 1 – \frac{180}{10(100-1)}$
$= 1 – \frac{180}{990}$
$= 1 – 0.18$
$= 0.82$
Hence, the rank correlation coefficient between the ability of the students in the subjects of Mathematics and Statistics obtained is $0.82.$
View full question & answer
Question 315 Marks
The following information is obtained by a survey conducted by a town planning committee of a state :

Find the rank correlation coefficient between the population of the cities and the rate of growth of the population.
Answer
Here, $n = 5;$
$R_x =$ Ranks for population $(x)$ and
$R_y =$ Ranks for rate of growth $(y)$
The table for calculating rank correlation coefficient is prepared as follows:

Rank correlation coefficient: $r = 1 – \frac{6 \Sigma d^{2}}{n\left(n^{2}-1\right)}$
Putting $n = 5$ and $\sum d^2 = 6$ in the formula,
$r = 1 – \frac{6(6)}{5\left(5^{2}-1\right)}$
$= 1 – \frac{36}{5(25-1)}$
$= 1 – \frac{36}{5 \times 24}$
$= 1 – \frac{36}{120}$
$= 1 – 0.3$
$= 0.7$
View full question & answer
Question 325 Marks
Find the correlation coefficient between the yearly per capita income $($in $?)$ and the price index of the people of six different cities from the following data:
Answer
Here, $n = 6; x =$ Yearly per capita income; $y =$ Price index
To make calculation of $r$ simple and easy.
We obtain new variables $u$ and $v$ by changing origin and scale.
The values of $x$ are in multiple of $1000$ and that of $y$ are in multiple of $10.$
Therefore taking $A = 30000; C_x = 1000$ for $x$ and $B = 180, C_y = 10$,
we obtain the variables $u = \frac{x-\mathrm{A}}{\mathrm{C}_{x}}= \frac{x-30000}{1000}$ and $v = \frac{y-\mathrm{B}}{\mathrm{C}_{y}} = \frac{y-180}{10}$.
The table for calculating r is prepared as follows:

Correlation coefficient:
$r = \frac{n \Sigma u v-(\Sigma u)(\Sigma v)}{\sqrt{n \Sigma u^{2}-(\Sigma u)^{2}} \cdot \sqrt{n \Sigma v^{2}-(\Sigma v)^{2}}}$
Putting $n = 6, \sum uv = 102, \sum u = 26, \sum v = – 10, \sum u^2 = 222$ and $\sum v^2 = 214$ in the formula,
$r = \frac{6 \times 102-(26)(-10)}{\sqrt{6 \times 222-(26)^{2}} \cdot \sqrt{6 \times 214-(-10)^{2}}}$
$= \frac{612+260}{\sqrt{1332-676} \cdot \sqrt{1284-100}}$
$= \frac{872}{\sqrt{656} \cdot \sqrt{1184}}$
$=\frac{872}{\sqrt{776704}}$
$= \frac{872}{881.31}$
$= 0.99$
Hence, the correlation coefficient between the yearly per capita income and the price index obtained is $0.99$.
View full question & answer
Question 335 Marks
An Engineer Association wants to know the relation between the production $($thousand units$)$ and the unit production cost of different factories. The information collected from six factories regarding their production and unit production cost is given below:

Find the correlation coefficient between production and cost per unit of production.
Answer
Here, $n = 6; x =$ Production; $y =$ Cost of production
Now, $x̄ = \frac{\Sigma x}{n} = \frac{143}{6} = 23.83$ thousand units; $ȳ = \frac{\Sigma x}{n} = \frac{497}{6}= ₹ 82.83$
$x̄$ and $ȳ$ are not integers and values of $x$ and $y$ are large.
Taking $A = 23$ for $x$ and $B = 82$ for $y.$
We obtain new variables $u = x – 23$ and $v = y – 82.$
The table for calculating $r$ is prepared as follows:

Correlation coefficient:
$r = \frac{n \Sigma u v-(\Sigma u)(\Sigma v)}{\sqrt{n \Sigma u^{2}-(\Sigma u)^{2}} \cdot \sqrt{n \Sigma v^{2}-(\Sigma v)^{2}}}$
Putting $n = 6, Σuv = – 335, Σu = 5, Σv = 5, \sum u^2 = 307$ and $\sum v^2 = 455$ in the formula,
$r = \frac{6 \times(-335)-(5)(5)}{\sqrt{6 \times 307-(5)^{2}} \cdot \sqrt{6 \times 455-(5)^{2}}}$
$= \frac{-2010-25}{\sqrt{1842-25} \cdot \sqrt{2730-25}}$
$= \frac{-2035}{\sqrt{1817} \cdot \sqrt{2705}}$
$= \frac{-2035}{\sqrt{4914985}}$
$=\frac{-2035}{2216.98}$
$= – 0.92$
Hence, the correlation coefficient between production and cost per unit of production obtained is $– 0.92.$
View full question & answer
Question 345 Marks
From the following information of the age $($in years$)$ and blood pressure $($in $mm),$ find the correlation coefficient between age and blood pressure:
Answer
Here, $n = 8; x =$ Age; $y =$ Systolic blood pressure
Now, $x̄ = \frac{\Sigma x}{n}=\frac{464}{8}= 58$ year; $x̄ = \frac{\Sigma y}{n}=\frac{1153}{8} = 144.125\ mm$
$x̄$ is integer and $ȳ$ is fraction. The values of $x$ and $y$ are large. So we calculate r by shortcut method.
Taking $A = 58$ and $B = 150,$ we obtain new variables $u = x – A = x – 58$ and $v = y – B = y – 150.$ The table for calculating $r$ is prepared as follows:

Correlation coefficient:
$r =\frac{n \Sigma u v-(\Sigma u)(\Sigma v)}{\sqrt{n \Sigma u^{2}-(\Sigma u)^{2}} \cdot \sqrt{n \Sigma v^{2}-(\Sigma v)^{2}}}$
Putting $n = 8, luu = 340, lu = 0, ID = -47, Eu^2= 314$ and $ID^2 = 1089$ in the formula,
$r = \frac{8 \times 340-(0)(-47)}{\sqrt{8 \times 314-(0)^{2}} \cdot \sqrt{8 \times 1089-(-47)^{2}}}$
$=\frac{2720}{\sqrt{2512} \cdot \sqrt{8712-2209}}$
$= \frac{2720}{\sqrt{2512} \cdot \sqrt{6503}}$
$= \frac{2720}{\sqrt{16335536}}$
$= \frac{2720}{4041.72}$
$= 0.67$
Hence, the correlation coefficient between age and blood pressure obtained is $0.67.$
View full question & answer
Question 355 Marks
The following information is available for five students selected from a school regarding the average number of study hours per day and the average number of sleeping hours:
Image
Calculate the correlation coefficient between the study hours and sleeping hours.
Answer
Here, $n = 5; x =$ No. of study hours, $y =$ No. of sleeping hours
Now, $x̄ = \frac{\Sigma x}{n} = \frac{30}{5} = 6$ hours; $ȳ = \frac{\Sigma y}{n} = \frac{40}{5} = 8$ hours
$x̄$ and $ȳ$ are integers. So the table for calculation of $r$ is prepared as follows:

Correlation coefficient:
$r = \frac{n \Sigma x y-(\Sigma x)(\Sigma y)}{\sqrt{n \Sigma x^{2}-(\Sigma x)^{2}} \cdot \sqrt{n \Sigma y^{2}-(\Sigma y)^{2}}}$
Putting $\sum (x – x̄) (y – ȳ) = – 16, \sum (x – x̄)^2 = 28$ and $\sum (y – y)^2 = 10$ in the formula,
$r = \frac{-16}{\sqrt{28} \cdot \sqrt{10}}$
$= \frac{-16}{\sqrt{280}}$
$= \frac{-16}{16.73}$
$= – 0.96$
Hence, the correlation coefficient between the study hours and sleeping hours obtained is $– 0.96.$
View full question & answer
Question 365 Marks
Find the correlation coefficient between capital $($in crore $₹)$ invested and the profit $($in crore $₹)$ from the following data:
Answer
Here, $n = 7;. x =$ Capital investment; $y =$ Profit
Now, $x̄ = \frac{\Sigma x}{n} = \frac{110}{7} = ₹ 15.71$ crore; $ȳ = \frac{\Sigma y}{n} = \frac{64}{7} = ₹ 9.14$ crore
$x̄$ and $ȳ$ are not integers and the values of $x$ and $y$ are not large. So the table for calculating $r$ is prepared as follows:

Correlation coefficient:
$r = \frac{n \Sigma x y-(\Sigma x)(\Sigma y)}{\sqrt{n \Sigma x^{2}-(\Sigma x)^{2}} \cdot \sqrt{n \Sigma y^{2}-(\Sigma y)^{2}}}$
Putting $n = 7, \sum xy = 1045, \sum x = 110, \sum y = 64, \sum x^2 = 1838$ and $\sum y^2 = 606$ in the formula,
$r = \frac{7 \times 1045-(110)(64)}{\sqrt{7 \times 1838-(110)^{2}} \cdot \sqrt{7 \times 606-(64)^{2}}}$
$= \frac{7315-7040}{\sqrt{12866-12100} \cdot \sqrt{4242-4096}}$
$= \frac{275}{\sqrt{766} \cdot \sqrt{146}}$
$= \frac{275}{\sqrt{111836}}$
$= \frac{275}{334.42}$
$= 0.82$
Hence, the correlation coefficient between the capital investment and profit obtained is $0.82.$
View full question & answer
Question 375 Marks
To check the ability of Mathematics and Logic of the students of a city a private educational institute gives twenty puzzles based on these two subjects to six children selected from various schools. The number of puzzles solved by them is given below:

Compute the correlation coefficient between performances of children in two types of puzzles using the given data.
Answer
Here, $n = 6;$
$x =$ No. of puzzles solved based on Mathematics
$y =$ No. of puzzles solved based on Logic
Here, $x̄ = \frac{\Sigma x}{n} = \frac{58}{6} = 9.67; ȳ = \frac{\Sigma y}{n} = \frac{61}{6} = 10.17$
$x̄$ and $ȳ$ are fractions. The values $x$ and $y$ are not large. So the table for calculating $r$ is prepared as follows:

Correlation Coefficient:
$r = \frac{n \Sigma x y-(\Sigma x)(\Sigma y)}{\sqrt{n \Sigma x^{2}-(\Sigma x)^{2}} \cdot \sqrt{n \Sigma y^{2}-(\Sigma y)^{2}}}$
Putting $n = 6, \sum xy = 598, \sum x = 58, \sum y = 61, \sum x^2 = 574$ and $\sum y^2 = 711$ in the formula,
$r = \frac{6 \times 598-(58)(61)}{\sqrt{6 \times 574-(58)^{2}} \cdot \sqrt{6 \times 711-(61)^{2}}}$
$= \frac{3588-3538}{\sqrt{3444-3364} \cdot \sqrt{4266-3721}}$
$= \frac{50}{\sqrt{80} \cdot \sqrt{545}}$
$= \frac{50}{\sqrt{43600}}$
$= \frac{50}{208.81}$
$= 0.24$
Hence, the correlation coefficient between performances of children in two types of puzzles obtained is $0.24.$
View full question & answer
Question 385 Marks
From the following information of a sample of ten students of a school regarding their marks in two subjects Accountancy and Statistics, find the coefficient of correlation between the marks of two subjects:
Answer
Here, $n = 10; x =$ Marks in Accountancy; $y =$ Marks in Statistics
Now, $x̄ = \frac{\Sigma x}{n} = \frac{640}{10} = 64$ marks; $ȳ = \frac{\Sigma y}{n} = \frac{610}{10} = 61$ marks
$x̄$ and $ȳ$ are integers. So the table for calculating $r$ is prepared as follows:

Correlation coefficient:
$r = \frac{\Sigma(x-\bar{x})(y-\bar{y})}{\sqrt{\Sigma(x-\bar{x})^{2}} \cdot \sqrt{\Sigma(y-\bar{y})^{2}}}$
Putting $\sum (x – x̄) (y – ȳ) = 3535, \sum (x – x̄)^2 = 4390$ and $\sum (y – ȳ)^2 = 3490$ in the formula,
$r = \frac{3535}{\sqrt{4390} \cdot \sqrt{3490}}$
$= \frac{3535}{\sqrt{15321100}}$
$= \frac{3535}{3914.22}$
$= 0.90$
Hence, the correlation coefficient between the marks of Accountancy and Statistics obtained is $0.90$
View full question & answer
Question 395 Marks
A local cottage industry making various snacks sells each snack in a packet of $100\ gm$. From a study for price determination regarding a new kind of wafer, the following information is obtained for the price and the demand:

Find the correlation coefficient between price of wafer and its demand.
Answer
Here, $n = 6; x =$ Price and $y =$ Demand
Now, $x̄ = \frac{\Sigma x}{n} = \frac{180}{6} = ₹ 30; ȳ = \frac{\Sigma y}{n} = \frac{132}{6}= 22 (’000$ units$)$
$x̄$ and $ȳ$ are integers. So the table for calculating $r$ is prepared as follows:

Correlation coefficient:
$r = \frac{\Sigma(x-\bar{x})(y-\bar{y})}{\sqrt{\Sigma(x-\bar{x})^{2}} \cdot \sqrt{\Sigma(y-\bar{y})^{2}}}$
Putting $\sum (x – x̄) (y – ȳ) = – 79, \sum (x – x̄)^2 = 90$ and $\sum (y – ȳ)^2 = 86$ in the formula,
$r = \frac{-79}{\sqrt{90} \cdot \sqrt{86}}$
$= \frac{-79}{\sqrt{7740}}$
$= \frac{-79}{87.98}$
$= – 0.90$
Hence, the correlation coefficient between the price and demand of wafers obtained is $– 0.90.$
View full question & answer
Question 405 Marks
The following information is obtained to study the effect of the use of fertilizer on yield of corn in a rural area:

Find the correlation coefficient between use of fertilizer and yield of corn.
Answer
Here, $n = 6; x =$ Use of fertilizer; $y =$ Yield of corn,
To make the calculation $r$ easy and simple, we take the new variables
$u = \frac{x-\mathrm{A}}{\mathrm{C}_{x}}$; $A = 1.5, C_x = 0.1$ and $v = \frac{y-B}{C_{y}}; B = 75, C_y = 5$.
The table for calculating $r$ is prepared as follows:

Correlation coefficient:
$r = \frac{n \Sigma u v-(\Sigma u)(\Sigma v)}{\sqrt{n \Sigma u^{2}-(\Sigma u)^{2}} \cdot \sqrt{n \Sigma v^{2}-(\Sigma v)^{2}}}$
Putting $n = 6, Euu = 78, Zu = – 4, Eu = – 10, Su^2= 106$ and $Eli^2 = 86$ in the formula,
$r = \frac{6 \times 78-(-4)(-10)}{\sqrt{6 \times 106-(-4)^{2}} \cdot \sqrt{6 \times 86-(-10)^{2}}}$
$= \frac{468-40}{\sqrt{636-16} \cdot \sqrt{516-100}}$
$= \frac{428}{\sqrt{620} \cdot \sqrt{416}}$
$= \frac{428}{\sqrt{257920}}$
$=\frac{428}{507.86}$
$= 0.84$
Hence, the correlation coefficient between use of fertilizer and yield of corn obtained is $0.84.$
View full question & answer
Question 415 Marks
The following data are given to study the relation between the number of persons in a family who drive vehicle and usage of petrol (in litre) per week:

Find the correlation coefficient between the number of members in a family and usage of petrol.
Answer
Here, $n = 7; x =$ No. of members per family who drive vehicle; $y =$ Weekly usage of petrol
To make calculation of r simple and easy, we obtain new variables.
$u = \frac{x-\mathrm{A}}{\mathrm{C}_{x}}$; where $A = 4, C_x = 1$ and $v = \frac{y-\mathrm{B}}{\mathrm{C}_{y}}$; where $B = 15.5, C_y = 0.5$.
The table for calculating $r$ is prepared as follows:

Putting $n = 7, \sum uv = 101, \sum u = – 4, \sum v = – 13, \sum u^2 = 20$ and $\sum v^2 = 795$ in the formula,
$r = \frac{7 \times 101-(-4)(-13)}{\sqrt{7 \times 20-(-4)^{2}} \cdot \sqrt{7 \times 795-(-13)^{2}}}$
$= \frac{707-52}{\sqrt{140-16} \cdot \sqrt{5565-169}}$
$= \frac{655}{\sqrt{124} \times \sqrt{5396}}$
$=\frac{655}{\sqrt{669104}}$
$=\frac{655}{817.99}$
$= 0.80$
Hence, the correlation coefficient between the number of members in a family and usage of petrol obtained is $0.80.$
View full question & answer
Question 425 Marks
From the following information obtained from a sample of $7$ families of a society regarding height of father $($in $cm)$ and height of his adult son $($in $cm),$ calculate the correlation coefficient:
Answer
Here, $n = 7; x =$ Height of father and $y =$ Height of son
Now, $x̄ = \frac{\Sigma x}{n} = \frac{1169}{7} = 167 \ cm;$
$ȳ = \frac{\Sigma y}{n} = \frac{1176}{7} = 168 \ cm;$
$x̄$ and $ȳ$ are Integers. So the table for calculating r is prepared as follows:

Correlation coefficient:
$r = \frac{\Sigma(x-\bar{x})(y-\bar{y})}{\sqrt{\Sigma(x-\bar{x})^{2}} \cdot \sqrt{\Sigma(y-\bar{y})^{2}}}$
Putting $\sum (x – x̄) (y – ȳ) = 25, \sum (x – x̄)^2 = 28$ and $\sum (y – ȳ)^2 = 34$ in the formula,
$r = \frac{25}{\sqrt{28} \cdot \sqrt{34}}$
$= \frac{25}{\sqrt{952}}$
$= \frac{25}{30.85}$
$= 0.81$
View full question & answer
Question 435 Marks
The following information is collected to study the relationship between the minimum day temperature and sale of woollen clothes during a particular day of winter for six different cities:

Draw a scatter diagram from this information and interpret it.
Answer
$X =$ Minimum day temperature $($Celsius$)$ and $Y =$ Sale of woollen clothes $(’000$ units$).$
Plotting the points of the corresponding ordered pairs $(12, 35), (20, 10), (8, 45), (5, 70), (15, 20), (24, 8)$ of variables $X$ and $Y$ on the graph paper, the scatter diagram is obtained as follows :

Interpretation: It is clear from the scatter diagram that all the points do not lie on the same line. Here, the changes in minimum day temperature and sale of woollen clothes are in opposite direction but are not in the same proportion. Hence, all points are not on the same line. So, there is partial negative correlation between minimum day temperature and the sale of woollen clothes.
View full question & answer
Question 445 Marks
A Company manufactures $R.O.$ plants for the factories. The information about the advertisement cost for its sale and the profit from the sale of $R.O.$ plants is given below:

Draw a scatter diagram from this information and state the nature of the relationship between the advertisement cost and profit earned from the sale of $R.O.$ plants.
Answer
$X =$ Advertisement cost $(‘0000\ ₹)$ and $Y =$ Profit $($in lakh $₹).$
Plotting the points corresponding to ordered pairs $(5, 8), (6, 7), (7, 9), (8, 10), (9, 13), (10, 12), (11, 13)$ of variables $X$ and $Y$ on the graph paper, the scatter diagram is obtained as follows:

Interpretation: It is clear from the scatter diagram that all the points do not lie on the same line. Here, the changes in advertisement cost and profit are in the same direction but not in the same proportion. Hence, all the points are not on the same line. So, there is partial positive correlation between advertisement cost and profit.
View full question & answer
Question 455 Marks
A ball pen making company wants to know the relation between the price $($in $₹)$ and supply $($in thousand units$)$ of its most selling Gel Pen. The following information is collected for it. Draw a scatter diagram and interpret it.
Answer
$X =$ Price $($in $₹), Y =$ Monthly Supply $(‘000$ units$).$
Plotting the points corresponding to the ordered pairs $(14, 32), (16, 50), (12, 20), (11, 12), (15, 45), (13, 30)$ and $(17, 53)$ of variables $X$ and $Y$ on the graph paper the scatter is obtained as follows:

Interpretation: It is clear from the scatter diagram that all the points do not lie on the same line. Here, the changes in price and supply are in the same direction but not in the same proportion. Hence, all the points are not on the same line. So, there is partial positive correlation price and supply.
View full question & answer
Question 465 Marks
From the following information, find the rank correlation coefficient between the sales (in thousand units) and the profit (in lakh ₹) :
Sales (thousand Units)255821572582590162
Profit (lakh ₹)651405001156565220340
Answer
Sales (X)Profit (Y)Rank $R_x$Rank $R_y$$d=R_x-R_y$$d^2$
25651.52- 0.50.25
581403.55- 1.52.25
2155008800
721155411
58653.521.52.25
25651.52- 0.50.25
902206600
1623407700
$\sum d=0$$\sum d^2=6$
$C F=\sum \frac{m^3-m}{12}$
For Sales (X) :
Value 25 repeats 2 times $(m=2): \frac{2^3-2}{12}=\frac{6}{12}=0.5$
Value 58 repeats 2 times $(m=2): \frac{2^3-2}{12}=0.5$
For Sales (Y) :
Value 65 repeats 3 times $(m=3): \frac{3^3-3}{12}=\frac{24}{12}=2$
Total $C F=0.5+0.5+2=3$
$r=1-\frac{6\left(\sum d^2+C F\right)}{n\left(n^2-1\right)}$
$r=1-\frac{6(6+3)}{8\left(8^2-1\right)}$
$r=1-\frac{6(9)}{8(63)}$
$r=1-\frac{54}{504}$
$r=1-0.1071$
$r \approx 0.89$
The rank correlation coefficient between sales and profit is 0.89 . This indicates a strong positive correlation between the two variables.
View full question & answer
Question 475 Marks
The following information is obtained to study the relationship between the advertisement cost and the sales of electric fans of the companies manufacturing electric fans. Find the correlation coefficient between advertisement cost and sales by Karl-Pearson's method :
CompanyABCDEF
Advertisement cost (lakh ₹)1401208010080180
Sales of electric fans (crore ₹)354515402050
Answer
$r=\frac{n \sum x y-\left(\sum x\right)\left(\sum y\right)}{\sqrt{\left[n \sum x^2-\left(\sum x\right)^2\right]\left[n \sum y^2-\left(\sum y\right)^2\right]}}$
$n=6$
xy$x^2$$y^2$$x y$
140351960012254900
120451440020255400
801564002251200
100401000016004000
802064004001600
180503240025009000
$\sum x$ = 700$\sum y$ = 205$\sum x^2$ = 89200$\sum y^2$ = 7975$\sum x y$ = 26100
$r=\frac{13100}{\sqrt{45200 \times 5825}}=\frac{13100}{\sqrt{263290000}}=\frac{13100}{16226.21} \approx 0.807$
View full question & answer
Question 485 Marks
From the following information obtained from a sample of 7 families of a society regarding height of husband (in cms) and height of wife (in cms), calculate the correlation coefficient :
Height of Husband (cm)170169168167166165164
Height of Wife (cm)172168170168165167166
Answer
$\bar{x}=\frac{1169}{7}=167$
$\bar{y}=\frac{1176}{7}=168$
$u=(x-\bar{x})$ and $V=(y-\bar{y})$ :
xy$\begin{array}{l}u=(x- \\ 167)\end{array}$$\begin{array}{l}V=(y- \\ 168)\end{array}$$u^2$$V^2$uV
1701723491612
16916820400
16817012142
16716800000
166165-1-3193
165167-2-1412
164166-3-2946
$\sum u=0$$\sum V=0$$\sum u^2= 28$$\sum V^2= 34$$\sum u V= 25$
$r=\frac{\sum u V}{\sqrt{\left(\sum u^2\right)\left(\sum V^2\right)}}$
$r=\frac{25}{\sqrt{28 \times 34}}$
$r=\frac{25}{\sqrt{952}}$
$r \approx \frac{25}{30.8545}$
$r \approx 0.81$
The correlation coefficient is $0 . 8 1$, which indicates a strong positive correlation between the height of the husband and the height of the wife.
View full question & answer
Question 495 Marks
For six different cities of Punjab state, the approximate figures regarding their density of population (per square Km) and the death rate (per thousand) are given below :
CityABCDEF
Density (per sq.km) x200500400700600300
Death rate (per thousand) y10121015912
Find the correlation coefficient between the density of population and death rate from this information.
Answer
$r = \frac{n\sum uv - (\sum u)(\sum v)}{\sqrt{n\sum u^{2} - (\sum u)^{2}} \sqrt{n\sum v^{2} - (\sum v)^{2}}}$
Cityxy$x^2$$y^2$xy
A20010400001002000
B500122500001446000
C400101600001004000
D7001549000022510500
E6009360000815400
F30012900001443600
Sum ( $\sum$ )139000079431500
$r=\frac{5,400}{\sqrt{1,050,000 \times 140}}$
$=\frac{5,400}{\sqrt{147,000,000}}$
$r \approx \frac{5,400}{12,124.36}$
$r \approx 0.445$
The correlation coefficient is approximately 0.445 , indicating a moderate positive correlation between population density and death rate in these cities.
View full question & answer
Question 505 Marks
Answer
Husband (X)Wife (Y)Rank RxRank Ryd = Rx - Ryd2
15615465.50.50.25
1531487700
18516222.5-0.50.25
1571575411
16316232.50.50.25
1911701100
16215445.5-1.52.25
$\sum d=0$$\sum d^2=4$
$C F=\sum \frac{m^3-m}{12} :$
Wife height 162 : repeats 2 times $(m=2) . C F_1=\frac{2^3-2}{12}=\frac{6}{12}=0.5$
Wife height 154 : repeats 2 times $(m=2) . C F_2=\frac{2^3-2}{12}=\frac{6}{12}=0.5$
Total CF = $0.5+0.5=1$
$r=1-\frac{6\left(\sum d^2+C F\right)}{n\left(n^2-1\right)}$
$r=1-\frac{6(4+1)}{7\left(7^2-1\right)}$
$=1-\frac{6(5)}{7(48)}$
$=1-\frac{30}{336}$
$=1-0.0893$
$r \approx 0.91$
The correlation coefficient is 0.91 , indicating a strong positive correlation between the height of the husband and the height of the wife in this sample.
View full question & answer