Questions

4 Marks Each

🎯

Test yourself on this topic

11 questions · timed · auto-graded

Question 14 Marks
Find the trend using four monthly moving averages for the following data showing monthly sales $($in lakh $₹)$ of a shop. \begin{array}{|l|c|c|c|c|c|c|c|c|c|c|} \hline Month & March & April & May & June & July & August & Sept. & Oct. & Nov. & Dec. \\ \hline Sales (lakh ₹) & 5 & 3 & 7 & 6 & 4 & 8 & 9 & 10 & 8 & 9 \\ \hline \end{array}
Answer

Calculation of four monthly moving averages
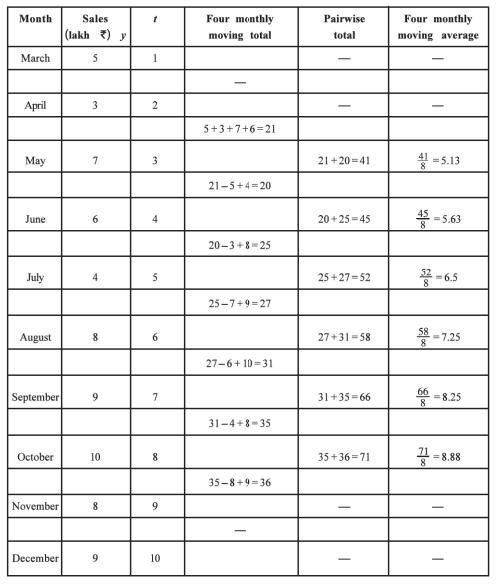
View full question & answer
Question 24 Marks
The quantity index numbers of consumption of edible oil in a state are given in the following table. Find the trend using five yearly moving averages.
Answer
Here, $n = 11.$ So $t = 1, 2, 3, ………. 11; y =$ Index number
To calculate $5$ yearly moving average the following table is prepared:
View full question & answer
Question 34 Marks
The following data show the sales $($in thousand $₹)$ of a commodity. Find the trend by graphical method.
Answer
Here, unit of time is year. $n = 10;$ So $t = 1, 2, 3, ……….., 10; y =$ sales.
The given time series is written as shown in the following table:

Taking t on $X-$axis and y on $Y-$axis, points $(1, 200), (2, 216), …, (10, 233)$ are plotted on the graph paper. Joining these points serially by lines, the curve of the given time series is obtained as follows:
The curve passing through close to most of the points of the curve of original series is the parabolic curve showing the trend of given time series.
View full question & answer
Question 44 Marks
The data about closing prices of shares of a company registered in a stock exchange for different months is given in the following table. Find the trend using three monthly moving averages.
Answer
Here, $n = 10$ months. So $t = 1, 2, 3, …., 10; y =$ share price
To calculate three monthly moving average the following table is prepared:
View full question & answer
Question 54 Marks
The following data are available for the number of passengers who travelled in the last $5$ years by the aircrafts of an airline company. Estimate the trend for the year $2016$ by fitting linear trend.
Answer
Here, $n = 5$ years. So $t = 1, 2, 3, 4, 5. y =$ No. of passangers.
We fit the equation of linear trend $ŷ = a + bt.$
To calculate the values of $‘a’$ and $‘b’$ the following table is prepared:

$t̄ = \frac{\Sigma t}{n}$
Putting $n = 5$ and $\sum t = 15,$ we get
$t̄ = \frac{15}{5} = 3$
$ȳ = \frac{\Sigma y}{n}$
Putting $n = 5$ and $\sum y = 214,$ we get
$ȳ = \frac{214}{5} = 42.8$
Now, $b = \frac{n \Sigma t y-(\Sigma t)(\Sigma y)}{n \Sigma t^{2}-(\Sigma t)^{2}}$
Putting $n = 5; \sum ty = 621; \sum t = 15; \sum y = 214$ and $\sum t^2 = 55$ in the formula,
$b = \frac{5(621)-(15)(214)}{5(55)-(15)^{2}}$
$= \frac{3105-3210}{275-225}$
$= \frac{-105}{50}$
$= – 2.1$
$a = ȳ – bt̄$
Putting $ȳ = 42.8, b = – 2.1$ and $t̄ = 3.5,$ we get
$a = 42.8 – (-2.1) (3)$
$= 42.8 + 6.3$
$= 49.1$
Equation of linear trend:
Putting $a = 49.1$ and $b = – 2.1$ in $ŷ = a + bt,$
we get
$ŷ = 49.1 – 2.11.$
Estimate of trend value for the year $2016:$
We take $t = 6$ corresponding to the year $2016$.
Putting $t = 6$ in $ŷ = 49.1 – 2.1 t,$ we get
$ŷ = 49.1 – 2.1 (6)$
$= 49.1 – 12.6$
$= 36.5 ($in $’000)$
Hence, the estimate of trend value for the year $2016$ obtained is $36.5$ thousand.
View full question & answer
Question 64 Marks
The data about exports $($in crore $₹)$ of readymade garments of a textile manufacturer are shown below:

Fit a linear trend to these data and estimate the trend for the export in the year $2017.$
Answer
Here, $n = 6$ year. So $t = 1, 2, …, 6; y =$ Export.
We fit the equation of linear trend $ŷ = a + bt.$
To calculate the values of a and b, the following table is prepared:

$t̄ = \frac{\Sigma t}{n}$
Putting $n = 6$ and $\sum t = 21,$ we get
$t̄ = \frac{21}{6} = 3.5$
$ȳ = \frac{\Sigma y}{n}$
Putting $n = 6$ and $\sum y = 141$, we get
$ȳ = \frac{141}{6} = 23.5$
Now, $b = \frac{n \Sigma t y-(\Sigma t)(\Sigma y)}{n \Sigma t^{2}-(\Sigma t)^{2}}$
Putting $n = 6; \sum ty = 495; \sum t = 21; \sum y = 141$ and $\sum t^2 = 91$ in the formula,
$b =\frac{6(495)-(21)(141)}{6(91)-(21)^{2}}$
$= \frac{2970-2961}{546-441}$
$= \frac{9}{105}$
$= 0.09$
$a = ȳ – bt̄$
Putting $ȳ = 23.5, b = 0.09$ and $t̄ = 3.5,$ we get
$a = 23.5 – 0.09 (3.5)$
$= 23.5 – 0.315$
$= 23.5 – 0.32$
$= 23.18$
Equation of linear trend:
Putting $a = 23.18$ and $b = 0.09$ in $ŷ = a + bt,$
we get
$ŷ = 23.18 + 0.09t$
Estimate of trend value of export of the year $2017:$
We take $t = 8$, corresponding to the year $2017$
Putting $t = 8$ in $ŷ = 23.18 + 0.09t,$ we get
$ŷ = 23.18 + 0.09 (8)$
$= 23.18 + 0.72 .$
$= ₹ 23.9 ($crore$)$
Hence, the estimate of trend value of export for the year $2017$ obtained is $₹ 23.9$ crore.
View full question & answer
Question 74 Marks
Describe the graphical method t measure trend.
Answer
Suppose $\left\{y_{t}: t =1,2 r_t \right\}$ is a time series and $n$ terms of the series are $y_{1}, y_{1} \ldots \ldots y_{n}$ respectively. Taking the time $t$ on $X$-axis and the term $y_{t}$ of the time series on Y-axis, the point $\left(1, y_{1}\right),\left(2, y_{2}\right) \ldots\left(n, y_{n}\right)$ are plotted on the graph paper. Then points are joined by line segments. The graph so obtained is called the graph of the time series. A continuous curve passing from the viscinity of most of the points is drawn. The curve so obtained is called the trend line of the time series. This is the simple and crude method of determining the trend of the time series. This method is quite easy to understand. But the mathematical form of the trend cannot be obtained by this method. When the plotted points of the time serles are widely scatter from one another, it is difficult to draw an unique curve representing the trend of the time series. In such a situation, more than one curve can be drawn representing the trend of the time series. As a result it becomes difficult to determine the trend of the time series.
View full question & answer
Question 84 Marks
Explain the meaning of moving average.
Answer
The short term variations are usually regular and have repetitions. The period of repetition of these variations are fond and their average is found for the given time series. This average of repetitions is known as the period of moving average. We find moving total of the variables of the given time series corresponding to the period of moving average. - Keeping the average value in the centre the average obtained by dividing moving total by the period of moving average is called moving average. - Suppose, the period of moving average is $3$ years, then $3$ yearly moving average $=$ ityoariymoeingtatal - Since the average value lies in the centre, we get the trend values that are free from short term variation. - If the period of moving average is odd number say $3,5,7, \ldots,$ moving average can be calculated easily. If it is even number its calculation becomes some what difficult.
View full question & answer
Question 94 Marks
State the limitations of graphical method.
Answer
The limitation of graphical method are as follows:
$(1)$ In this method different people draw different curves. Hence, the uniformity is not maintained in the trend and its estimates.
$(2 )$ This is not a mathematical method. So it is not possible to know the reliability of the estimates.
$(3 )$ The exact form of the trend line of the series cannot be obtained by this method.
$(4 )$ When the plotted points of the time series are widely scatter from one another, then instead of drawing an unique curve of the trend of the time series, more than one curve can be drawn representing the trend.
View full question & answer
Question 104 Marks
Explain the irregular component.
Answer
In the variation of time series, seasonal component and cyclical component are regular component. More and above these there is effect of irregular or random component which is short- term effect. , Cyclical component $C$ from the term $R_t = y_t – (T_t + S_t + C_t). ,$ of the time series is known as random or irregular component and is given by Random component are subject to natural forces like flood, draught, earthquake, political crisis and random causes like fire, accident, etc. Sometimes it is seen on account of technological innovations. Random component cannot be controlled nor can be predicted in advance. Hence the variable quantity of time series cannot be exactly predicted by studying the time series. Sometimes, effect of random component is temporary and transient. In such situation the stipulated targets of agricultural and industrial production cannot be achieved.
View full question & answer
Question 114 Marks
How does seasonal component differ from the cyclical component?
Answer
Seasonal component and cyclical component differ in the following manner:,
— The variations occurring in the time series almost regularly over less than one year is the effect of seasonal component, while that of more than a year is the effect of cyclical component.
—The period of oscillation of seasonal component is usually less than a year, while it can be $2$ to $10$ years and in special circumstances it can also be $10$ to $15$ years.
— Seasonal component is the effect of natural factors and man-made factors, while cyclical component is the effect of economic situations and business cycles.
—The increase in the sales of readymade garments and shoes daring festivals is an example of seasonal component while the cycles of boom and recession are the examples of cyclical component.
View full question & answer
4 Marks Each - Statistics STD 12 Commerce Questions - Vidyadip