Question 14 Marks
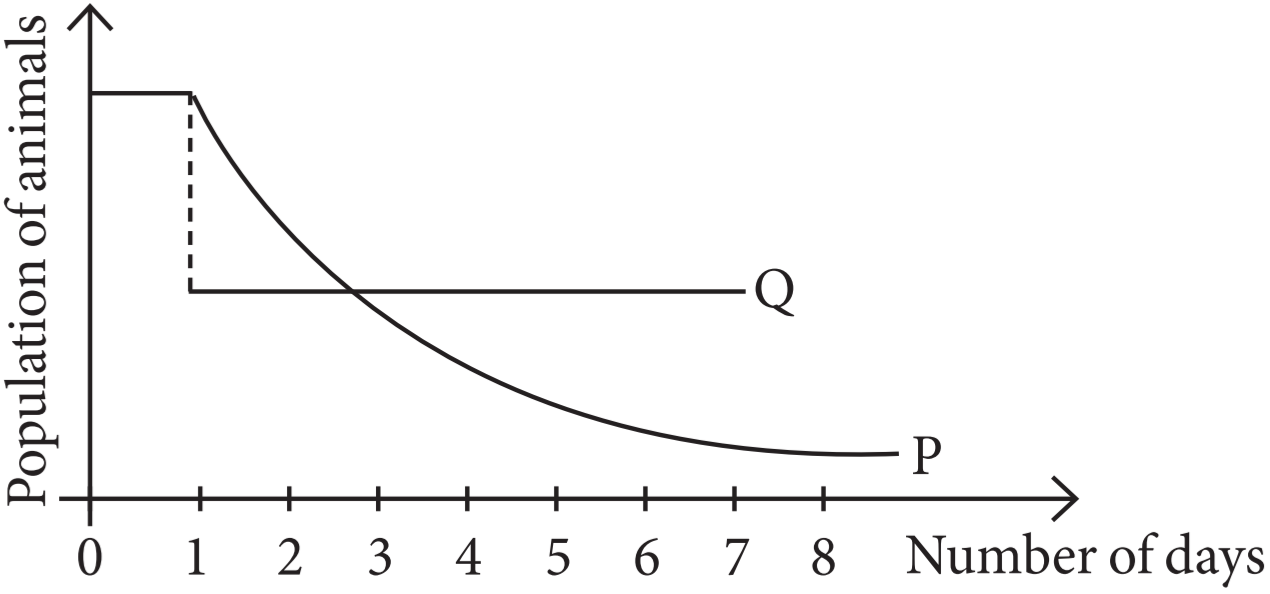
Read the following and answer any four questions from (i) to (v) given below: Within a region, species richness increases with increasing explored area, but only upto a limit. TI1e given graph explains this relationship. 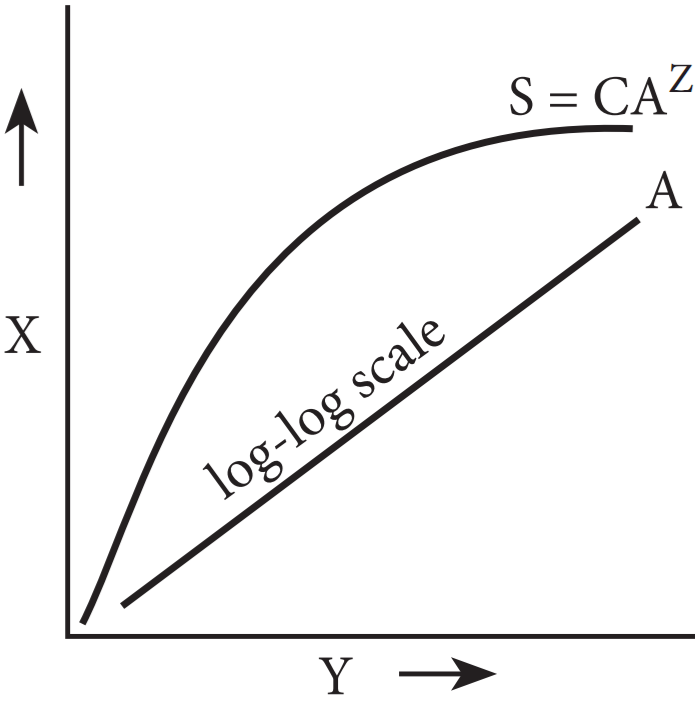
- What does the given figure show?
- Rivet-popper hypothesis.
- Species-area relationship.
- Proportionate number of species of major taxa.
- $\alpha-\text{ecological diversity }$
- Equation for relationship (A) between species richness and area is:
-
$\log\text{ S}=\log\text{ C}+\text{Z }\log\text{ A}$
-
$\log\text{ C}=\log\text{ S}+\text{Z }\log\text{ A}$
-
$\text{Z }\log\text{ A}=\log\text{ S}+\log\text{ C}$
-
$\log\text{ S}=\log\text{ C}+\log\text{ A}$
- What is the value of slope of line or regression coefficient Z for frugivorous birds?
- 0.1 - 0.2
- 1.15
- 0.01 - 0.1
- 0.6 - 1.2
- The shape of curve for relationship between species richness and areas for wide variety of taxa is:
- Straight line.
- Parabola.
- Rectangular hyperbola.
- Bell shaped.
- Who gave this concept of increase in species richness with increasing offered area?
- Humboldt.
- Odum.
- Edward Wilson.
- Paul Ehrlich.
Answer
View full question & answer→- (b) Species-area relationship.
-
(a) $\log\text{ S}=\log\text{ C}+\text{Z }\log\text{ A}$
Explanation:
On a logarithmic scale, the relationship between species richness and area is a straight line.
- (b) 1.15
Explanation:
The regression coefficient Z have a value of 1.15 for frugivorous birds and mammals of tropical forests of different continents.
- (c) Rectangular hyperbola.
- (b) Odum.
Explanation:
While exploring the wilderness South American jungles, Alexander von Humboldt found that within a region, the species richness increased with increasing area but upto a certain limit.