Question 13 Marks
Given below is an equation describing the Species$-$Area relationship between species richness and area for a wide variety of taxa as angiosperm plants, birds, bats etc.
$S = CA^Z$
$a.$ Give a graphical representation of the given equation showing Species$-$Area relationship.
$b.$ What does $S$ represent in the given equation?
$c.$ What is the value of $Z \ ($regression coefficient$)$ for frugivorous birds and mammals in the tropical forests of different continents?
Answer
View full question & answer→$a.$ The given equation's graphical representation of the relationship between species and area is as follows:
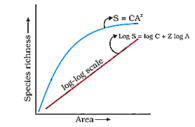
$b.$ The species richness is represented by $S$ in the given equation.
$c.$ The regression coefficient $Z$ is the slope of the line. The slope is found to be $1.15$ for frugivorous $($fruit$-$eating$)$ birds and mammals in tropical woods on various continents.
$b.$ The species richness is represented by $S$ in the given equation.
$c.$ The regression coefficient $Z$ is the slope of the line. The slope is found to be $1.15$ for frugivorous $($fruit$-$eating$)$ birds and mammals in tropical woods on various continents.