Question 14 Marks
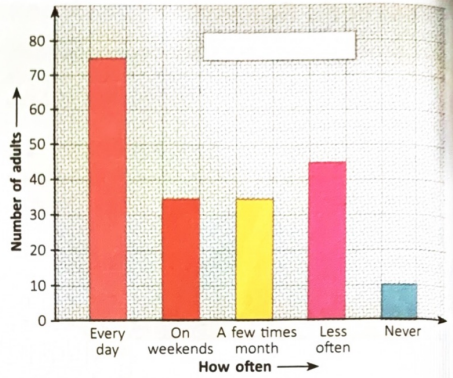
The following bar graph shows the expenditure (in thousands ) of Mr Jones' family during the last four months of the year.
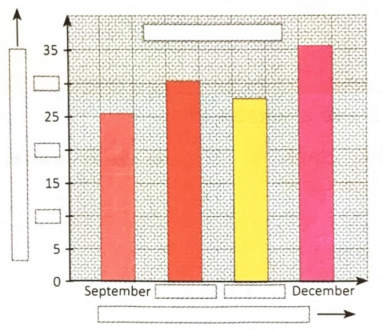
Fill in the missing parts of the bar graph so that it becomes self explanatory.
Fill in the missing parts of the bar graph so that it becomes self explanatory.
Answer
View full question & answer→Title: Ependiture of Mr Jones' family during last four months of a year.
Vertical axis: Expenditure (in thousands ₹): $10, 20, 30$
Horizontal axis: Months; October, November
Vertical axis: Expenditure (in thousands ₹): $10, 20, 30$
Horizontal axis: Months; October, November