Question 13 Marks
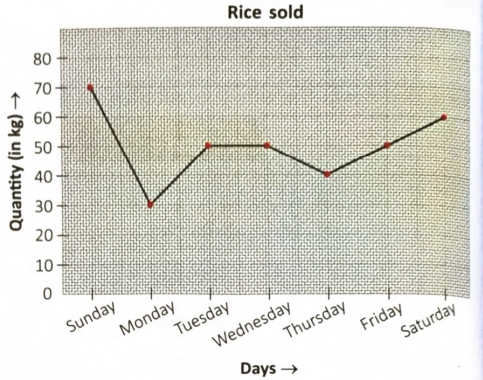
The given line graph shows the number of children participated in an exhibition during five years.
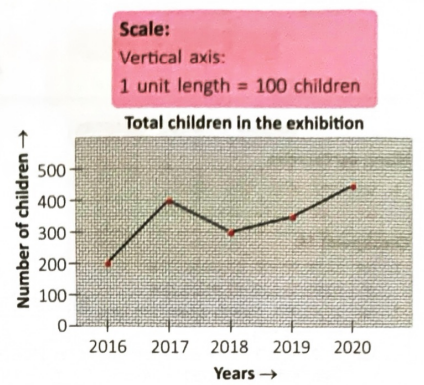
Look at the line graph and answer the following questions.
$(a)$ How many children participated in the year $2018?$
$(b)$ How many children participated in the year $2017?$
$(c)$ By how much has the number of children increased in $2020$ from $2016?$
Look at the line graph and answer the following questions.
$(a)$ How many children participated in the year $2018?$
$(b)$ How many children participated in the year $2017?$
$(c)$ By how much has the number of children increased in $2020$ from $2016?$
Answer
View full question & answer→$(a) 300$
$(b) 400$
$(c) 250$
$(b) 400$
$(c) 250$
 $= 6$ bands