Questions

Answer the following (4 mark each) :

🎯

Test yourself on this topic

12 questions · timed · auto-graded

Question 14 Marks
The given pie chart shows the kind of fruits (in weight) in a mixed fruit basket. Each sector of the pie shows a type of fruits. Use it to answer the following questions.
Image
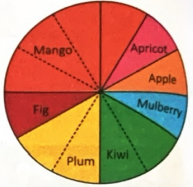
$(a)$ Which fruit is the maximum in quantity in the basket?
$(b)$ Name the fruits that are equal in quantity.
$(c)$ Name all possible pairs of fruits that together weigh equal to the weight of kiwi.
$(d)$ If there are total $12 \ kg$ fruits, then what fraction is $(i)$ Mango $(ii)$ Plum $(iii)$ Kiwi $(iv)$  Kiwi, and apple of the total weight?
Answer
$(a)$ Mando
$(b)$ Apricot, apple, mulberry; Fig; Plum, kiwi
$(c)$ Apricot, apple; apple, apricot and mulberry; fig, apricot; fig, mulberry; fig, apple; kiwi$-2 \ kg,$ apple $-1 \ kg$
$(d) (i) \frac{1}{3}$
$(ii) \frac{1}{6}$
$(iii) \frac{1}{6}$
$(iv) \frac{1}{4}$
View full question & answer
Question 24 Marks
The following data gives information about the number of tickets sold by a group of $5$ friends for the "Winter-Fiesta" organised by a school.
Name Hans Madhup Vihaan Yakshita Neysa
Number of tickets sold $100$ $150$ $200$ $75$ $100$

Draw a bar graph by taking $1$ grid line $= 25$ tickets.
Answer
Self
View full question & answer
Question 34 Marks
The following table shows the survey of $72$ children about their favorite fruit.
Favourite Fruit Apple Banana Guava Grapes
Number of children $12$ $18$ $6$ $36$
Answer
Self
View full question & answer
Question 44 Marks
A fair dice is thrown $16$ times and number of times $1, 2, 3, 4, 5$ or $6$ appeared on the dice is recorded as shown.
Number appeared on a dice $1$ $2$ $3$ $4$ $5$ $6$
Number of times $1$ $4$ $5$ $1$ $3$ $2$
Answer
Self
View full question & answer
Question 54 Marks
Image
$(a)$ Which pet animal do boys prefer the most$?$
$(b) $ Which pet animal do girls prefer the most$?$
$(c)$ Which pet animals are liked by both boys and girls equally$?$
$(d)$ How many more girls like rabbits than boys$?$
Answer
$(a)$ Dog $(b)$ Rabbit $(c)$ Fish $(d) 20.$
View full question & answer
Question 64 Marks
Draw a double bar graph to compare the favorite subjects of boys and girls in a class for the given data.
Subjects Maths Science English Hindi
Boys $8$ $6$ $5$ $4$
Girls $3$ $11$ $10$ $6$
Answer
Self
View full question & answer
Question 74 Marks
Number of customers were recorded by a restaurant owner during different parts of the day.
Time Intervals Morning Afternoon Evening Late Evening
Number of customers $30$ $75$ $45$ $90$
Answer
Self
View full question & answer
Question 84 Marks
A Maths and Art competition was organised by a school. Number of entry forms received from different sections of class $V$ is shown in the given table. Display it in the form of a bar graph.
Sections of Class $V$ $A$ $B$ $C$ $D$ $E$
Number of entry forms received $20$ $25$ $18$ $23$ $25$
Answer
Self
View full question & answer
Question 94 Marks
Information of number of dresses designed by Rohit for his fashion studio in a particular week is given in the table below. Represent it by drawing a bar graph.
Number of dresses designed $9$ $7$ $5$ $6$ $8$
Weekdays Monday Tuesday Wedneday Thrusday Friday
Answer
Self
View full question & answer
Question 104 Marks
Draw a bar graph for the information given in the table.
Name of the student Sujata Fiza Jasvinder Singh David
Points scored in a game $50$ $45$ $65$ $55$
Answer
Self
View full question & answer
Question 114 Marks
The table given below shows the comparison of sales of different colour T-shirts in summer in a garment store. Construct a bar graph so that the comparison is made at a glance only.
Colour of T-shirt Red Blue Yellow White Black
Number of T-shirts sold $600$ $700$ $500$ $1050$ $450$
Answer
Self
View full question & answer
Question 124 Marks
Image
$1.$ Which is the most favorite subject?
$2.$ Which two subjects are tied?
$3.$ How many students polled in total?
$4.$ Arrange the subjects in ascending order of their popularity among the students polled.
$5.$ How many more students liked Science than Social Science?
$6. $ How many students chose Maths as their favorite subject?
$7.$ What title is given to the bar graph? Suggest another title for it.
Answer
$1. $ Maths
$2.$ Sanskrit ans Social science
$70$ students
Sanskrit or Social science $ < $ Hindi $ < $ Science $ < $ Maths
$8$ Students
$20$
View full question & answer
Answer the following (4 mark each) : - MATHS STD 5 Questions - Vidyadip