Question types

DATA HANDLING AND PRESENTATION [NEW] question types

38 questions across 3 question groups — pick any mix to generate a MATHS paper with step-by-step answer keys.

38
Questions
3
Question groups
5
Question types
Sample Questions

DATA HANDLING AND PRESENTATION [NEW] questions

One sample from each question group in this chapter. Select any group above to see the full set with answer keys.

A survey was carried out in a certain school to find about different modes of transport used by students to travel to school each day. 30 students of class VI were interviewed and the data obtained was displayed in the form of a pictographs given below:
Image
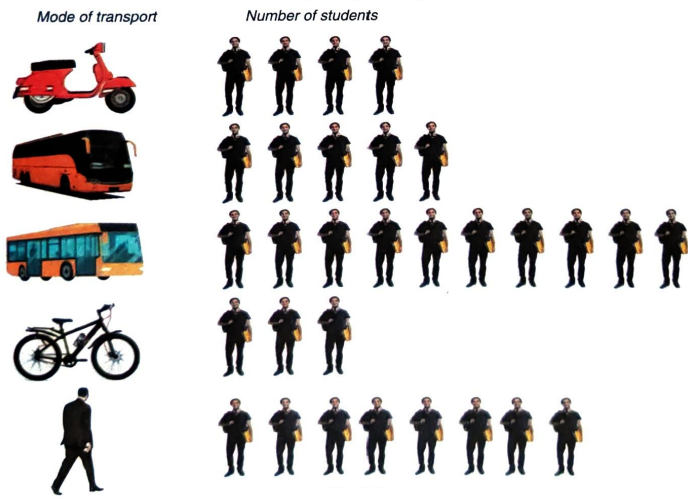
Look at the above pictograph and answer the following questions:
(i) How many students are using cycle or walking as a mode of travel?
(ii) Which is most popular mode of travel?
View full solution
Following is the choice of sweets of 30 students of class VI: Ladoo, Barfi, Ladoo, Jalebi, Ladoo, Rasgulla, Jalebi, Ladoo, Barfi, Rasgulla, Ladoo, Jalebi, Jalebi Rasgulla, Ladoo, Rasgulla, Jalebi, Ladoo, Rasgulla, Ladoo, Rasgulla, Jalebi, Ladoo, Rasgulla, Ladoo, Ladoo, Barfi, Rasgulla, Rasgulla, Ladoo.
(i) Arrange the names of sweets in a table using tally marks.
(ii) Which sweet is preferred by most of the students?
View full solution
In a mathematics test following marks were obtained by 40 students of class VI. Arrange these marks in a table using, tally marks.
8137655442
4953716527
7384289586
7456964466
(i) Find how many students obtained marks equal to or more than 7?
(ii) How many students obtained marks below 4?
View full solution
Prepare a frequency table of the following ages (in years) of 30 students of class VIII in your school:
13, 14, 13, 12, 14, 13, 14, 15, 13, 14, 13, 14, 16, 12, 14
13, 14, 15, 16, 13, 14, 13, 12, 17, 13, 12, 13, 13, 13, 14,
View full solution
In a study of number of accidents per day, the observations for 30 days were obtained as follows:
6356432542
4212205461
6053615526
Prepare a frequency distribution table.
View full solution
The following pictograph shows different subject books which are kept in a library.
Image
(i) How many English books are there in the library?
(ii) How many maths books are there?
(iii) Which books are maximum in number?
(iv) Which books are minimum in number?
View full solution
Q 103 Marks Question3 Marks
Construct a frequency distribution table for the following marks obtained by 25 students in a history test in class VI of a school:
9, 17, 12, 20, 9, 18, 25, 17, 19, 9, 12, 9, 12, 18, 17, 19, 20, 25, 9, 12, 17, 19, 19, 20, 9
(i) What is the range of marks?
(ii) What is the highest mark?
(iii) Which mark is occurring more frequently?
View full solution
View full solution
The following data gives the production of foodgrains (in thousand tonnes) for some years:
Year199519961997199819992000
Production (in thousand tonnes)120150140180170190
Represent the above data with the help of a bar graph.
View full solution
The following data gives the amount of loans (in crores of rupees) disbursed by a bank during some years:
Year19921993199419951996
Loan (in crores of rupees)2833555580
(i) Represent the above data with the help of a bar graph.
(ii) With the help of the bar graph, indicate the year in which amount of loan is not increased over that of the preceding year.
View full solution

Generate a DATA HANDLING AND PRESENTATION [NEW] paper free

Pick question groups from the list above, set marks and difficulty, and export a branded PDF with step-by-step answer keys. First 3 chapters free — no signup.

Download App