Questions

1 Marks Question

Take a timed test

15 questions · self-marked practice — reveal the answer and mark yourself.

Question 11 Mark
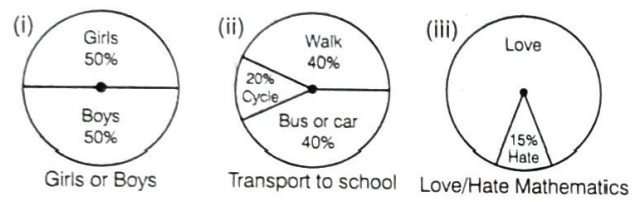
Each of the following pie charts (see the following figures), gives you a different plece of information about your class. Find the fraction of the circle representing each of these information.
Image
Answer
(i) Here, given pie chart shows $100 \%$ students of your class, out of which $50 \%$ are girls and $50 \%$ are boys.
$\therefore$ Fraction of the circle representing girls
$=\frac{\text { Percentage of girls }}{\text { Percentage of all students }}=\frac{50}{100}=\frac{1}{2}\quad$ [dividing numerator and denominator by 50]
Fraction of the circle representing boys
$=\frac{\text { Percentage of boys }}{\text { Percentage of all students }}=\frac{50}{100}=\frac{1}{2}\quad$ [dividing numerator and denominator by 50]
(ii) Do same as part (i)
(iii) Do same as part (i)
View full question & answer
Question 21 Mark
Percentage wins in ODI by 8 top cricket teams.
TeamsFrom Champions Trophy to World Cup 2006Last 10 ODI in 2007
South Africa75%78%
Australia61%40%
Sri Lanka54%38%
New Zealand47%50%
England46%50%
Pakistan45%44%
West Indies44%30%
India43%56%
Answer
Here, comparison between percentage wins in ODI by 8 top cricket teams is given, so to represent the given information, we draw the double bar graph. So, draw two perpendicular axes OX and OY. Take teams on OX and percentage wins in ODI on OY. Choose a suitable scale for OX and OY to draw double bar graph.
Image
View full question & answer
Question 31 Mark
Draw an appropriate graph to represent the given information.
Children who preferSchool ASchool BSchool C
Walking405515
Cycling452535
Answer
Here, comparison of two activities is given, so to represent the given information, we draw the double bar graph.
So, draw two perpendicular axes OX and OY. Take schools on OX and number of children on OY. Choose a suitable scale for OX and OY to draw double bar graph.
Thus, we get the following double bar graph
Image
View full question & answer
Question 41 Mark
Draw an appropriate graph to represent the given information.
MonthsNumber of watches sold
July1000
August1500
September1500
October2000
November2500
December1500
Answer
Here, to represent the given information, we draw the bar graph. So, draw two perpendicular axes OX and OY. Take months on OX and number of watches sold on OY. Choose a suitable scale for OX and OY and draw bars of equal width with equal gaps in between. Thus, we get the following bar graph
Image
View full question & answer
Question 51 Mark
If we change the position of any of the bars of a bar graph, would it change the information being conveyed? Why?
Answer
No, because bar heights give the quantity for each category. Since, the height remains unchanged. So, the information conveyed regarding the quantity remain unchanged.
View full question & answer
Question 61 Mark
Choice of food for a group of people.
Favourite foodNumber of people
North Indian30
South Indian40
Chinese25
Others25
Total120
Answer
To display choice of food for a group of people, bar graph is more appropriate.
View full question & answer
Question 81 Mark
A bar graph showing two sets of data simultaneously. It is useful for the comparison of the data.
Image
(i) What is the information given by the double bar graph?
(ii) In which subject has the performance improved the most?
(iii) In which subject has the performance deteriorated?
(iv) In which subject is the performance at par?
Answer
From the given double bar graph, we find that
(i) The double bar graph gives the information about the comparision of marks in different subjects obtained by a student in the years 2005-06 and 2006-07.
(ii) The performance has improved the most in Maths.
(iii) The performance has deteriorated in English.
(iv) The performance has remained at par in Hindi.
View full question & answer
Question 91 Mark
Read the following bar graph and answer the following questions
Image
(i) What is the information given by the bar graph?
(ii) In which year is the increase in the number of students maximum?
(iii) In which year is the number of students maximum?
(iv) State whether true of false:
'The number of students during 2005-06 is twice that of 2003-04.'
Answer
From the given bar graph, we find that
(i) The information given by the bar graph is the number of students in Class VIII in various academic years in the school.
(ii) In the year 2004-05, increase in the number of students is maximum.
(iii) The number of students is maximum in the year 2007-08.
(iv) False, because the number of students during 2005-06 is more than twice that of 2003-04.
View full question & answer
Question 101 Mark
Read the following pictograph and answer the following questions.
Image
(i) How many cars were produced in the month of July?
(ii) In which month were maximum number of cars produced?
Answer
From the above pictograph, we observe that
(i) 250 cars were produced in the month of July.
(ii) The maximum number of cars were produced in the month of September i.e. 400.
View full question & answer
Question 111 Mark
The probability of the occurence of an event is $\frac{3}{4}.$ Find the probability of non-occurence of that event.
Answer
Given, probability of occurence of that event $=\frac{3}{4}$
$\begin{aligned}\therefore \text { Probability of non-occurence } & =1-\frac{3}{4} \\& =\frac{1}{4}\end{aligned}$
View full question & answer
Question 121 Mark
Rohan and Shalu are playing with 5 cards as shown in the figure. What is the probability of Rohan picking a card without seeing that has the number 2 on it?
Image
Answer
$\because$ Total number of outcomes $=5$
$\therefore$ Required probability $=\frac{2}{5}$
View full question & answer
Question 131 Mark
The probability that it will rain tomorrow is 0.25. What is the probability that it will not rain tomorrow?
Answer
Given, probability that it will rain tomorrow $=0.25$
$\therefore$ Probability that it will not rain tomorrow
$\begin{array}{l}=1-\text { Probability that it will rain tomorrow } \\=1-0.25=0.75\end{array}$
View full question & answer
Question 141 Mark
Image
(i) Which is the most favourable game?
(ii) Find the angle of sector of circle for Chess players.
Answer
(i) The most favourable game is Tennis.
(ii) Fraction value of Chess $=\frac{1}{4}$
$\therefore$ Angle of sector $=360^{\circ} \times \frac{1}{4}=90^{\circ}$
View full question & answer
Question 151 Mark
Find the fraction of the circle representing each of these information.
Image
Answer
$\text {Golf players }=\frac{3}{20} $
$ \text {Hockey players }=\frac{1}{5} $
$ \text {Tennis players }=\frac{2}{5} $
$ \text {and Chess players }=\frac{1}{4}$
View full question & answer
1 Marks Question - MATHS STD 8 Questions - Vidyadip