Questions

3 Marks Question

🎯

Test yourself on this topic

10 questions · timed · auto-graded

Question 13 Marks
Draw a pie chart of the data given below The time spent by a child during a day.
Sleep8 h
School6 h
Home work4 h
Play4 h
Others2 h
Answer
We know that total angle at the centre of a circle is $360^{\circ}$.
$\text { Fraction part for sleep }=\frac{\text { Hours for sleep }}{\text { Total hours }}$
$=\frac{8}{24}=\frac{1}{3}$
$\therefore$ Central angle of sector for sleep $=\frac{1}{3} \times 360^{\circ}=120^{\circ}$
Similarly, for other central angle, we get the following table:
First, we find the central angle corresponding to given activities.
ActivitlesHoursFraction partsCentral angles
Sleep8$\frac{8}{24}=\frac{1}{3}$$\frac{1}{3} \times 360^{\circ}=120^{\circ}$
School6$\frac{6}{24}=\frac{1}{4}$$\frac{1}{4} \times 360^{\circ}=90^{\circ}$
Home work4$\frac{4}{24}=\frac{1}{6}$$\frac{1}{6} \times 360^{\circ}=60^{\circ}$
Paly4$\frac{4}{24}=\frac{1}{6}$$\frac{1}{6} \times 360^{\circ}=60^{\circ}$
Others2$\frac{2}{24}=\frac{1}{12}$$\frac{1}{12} \times 360^{\circ}=30^{\circ}$
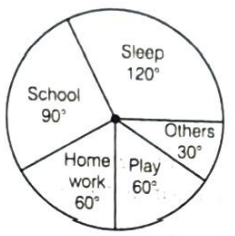
Now, draw a circle and divide it into sectors with corresponding central angle, we get the required pie chart given below :
Image
View full question & answer
Question 23 Marks
Answer the following questions based on the pie chart in following figure
(i) Which type of programmes are viewed the most?
(ii) Which two types of programmes have number of viewers equal to those watching sports channels?
Image
Viewers watching different types of channels on TV
Answer
(i) From the given pie chart, we have the following table
Types of viewersPercentage
Sports viewers25
News viewers15
Informative viewers10
Entertainment viewers50
Since, percentage of entertainment is highest, so entertainment programmes are viewed the most.
(ii) Here, number of viewers watching news $=15 \%$
Number of viewers watching informative $=10 \%$
$\therefore$ Sum of numbers of viewers watching news and informative $=(15+10) \%=25 \%$
$=$ Number of viewers watching sports
Hence, the news and informative programmes have number of viewers equal to those watching sports channel.
View full question & answer
Question 33 Marks
The adjoining pie chart gives the marks scored in an examination by a student in Hindi, English, Mathematics, Social Science and Science. If the total marks obtained by the students were 540, then answer the following questions:
Image
(i) In which subject did the student score 105 marks?
[Hint : for 540 marks, the central angle $=360^{\circ}$.
So, for 105 marks, what is the central angle?]
(ii) How many more marks were obtained by the student in Mathematics than in Hindi?
(iii) Examine whether the sum of the marks obtained in Social Science and Mathematics is more than that in Science and Hindi.
[Hint : Just study the central angles.]
Answer
Here, the total marks obtained by the student are 540 . For 540 marks, the complete central angle is $360^{\circ}$.
(i) Since, for 540 marks, central angle $=360^{\circ}$
So, for 1 mark, central angle $=\frac{360^{\circ}}{540}$
Then, for 105 marks, central angle
$=\frac{360^{\circ}}{540} \times 105=\left(\frac{36 \times 105}{54}\right)^{\circ}=70^{\circ}$
Marks obtained in Hindi = 105
Difference between marks in Mathematics and Hindi = (135 - 105) = 30
Hence, the student obtained 30 marks more in Mathematics than in Hindi.
(iii) Marks obtained by the student in Mathematics =135
Marks obtained by the student in Social Science
= Fraction part for Social Science × Total marks
$=\frac{65^{\circ}}{360^{\circ}} \times 540=\frac{65 \times 54}{36}=\frac{65 \times 6}{4}=97.5$
$\therefore$ Sum of the marks obtained in Social Science and Mathematics $=97.5+135=232.5$
Now, marks obtained by the student in Science
= Fraction part of Science × Total marks
$=\frac{80^{\circ}}{360^{\circ}} \times 540=\frac{80 \times 6}{4}=120$
and marks obtained by the student in Hindi
$=$ Fraction part for Hindi $\times$ Total marks
$=\frac{70^{\circ}}{360^{\circ}} \times 540=\frac{70 \times 6}{4}=105$
$\therefore$ Sum of the marks obtained in Hindi and Science
$=105+120=225$
Hence, sum of the marks obtained in Social Science and Mathematics is more than that in Science and Hindi.
View full question & answer
Question 43 Marks
Identify which symbol should appear in each sector.
Image
Answer
Total quantity obtained from the given four symbols
$=800+700+550+450=2500$
$\begin{aligned} \therefore \quad 28 \% \text { of } 2500 & =\frac{28}{100} \times 2500=700 \\ 22 \% \text { of } 2500 & =\frac{22}{100} \times 2500=550 \\ 18 \% \text { of } 2500 & =\frac{18}{100} \times 2500=450 \\ 32 \% \text { of } 2500 & =\frac{32}{100} \times 2500=800\end{aligned}$
Image
View full question & answer
Question 53 Marks
(i) From a pack of cards, the following cards are kept face down
Image
Suhail wins, if he picks up a face card. Find the probability of Suhail winning?
(ii) Now, the following cards are added to the above cards:
Image
What is the probability of Suhail winning now? Reshma wins, if she picks up a 4. What is the probability of Reshma winning? [queen, king and jack cards are called face cards.]
Answer
(i) $\text P($Suhail winning $)=\frac{1}{7}$
(ii) $\text P$ $($Suhail winning now$)$ $=\frac{4}{15} \quad[\because$ there are 4 face cards$]$
$\text P($Reshma winning $)=\frac{4}{15}\quad$ $[\because$ there are four 4 numbers card$]$
View full question & answer
Question 63 Marks
Given below is a pie chart showing the time spend by a group of 700 children in different games. Observe it and answer the questions that follow.
Image
(i) How many children spend atleast 1 h in playing games?
(ii) How many children spend more than 2 h in playing games?
(iii) How many children spend 3 or lesser hours in playing games?
(iv) Which is greater number of children who spend 2 h or more per day or number of children who play for less than 1 h?
Answer
(i) Number of children spend atleast 1 h in playing games i.e. the number of children playing 1 h or more than 1 h.
So, the required number of children
$=$ Total number of children - Number of children spend less than 1 h
$=700-6 \%$ of $700$ students
$\begin{array}{l}=700-\frac{6}{100} \times 700 \\ =700-42=658\end{array}$
(ii) Number of children spend more than 2 h in playing games $=(34+10+4) \%$ of the total number of students
$=48 \% \text { of } 700=\frac{48}{100} \times 700=336$
(iii) Number of children spend 3 or lesser hours in playing games $=(34+30+16+6) \%$ of the total number of
$\begin{aligned}\text {students } & =86 \% \text { of } 700 \\& =\frac{86}{100} \times 700=602\end{aligned}$
(iv) Number of children who spend 2 h or more per day
$\begin{array}{l}=(30+34+10+4) \% \\=78 \% \text { of total students }\end{array}$
Number of children who spend less than 1 h
$=6 \% \text { of total students }$
So, clearly number of children who spend 2 h or more per day is greater than the number of children, who play for less than 1 h.
View full question & answer
Question 73 Marks
Read the following chart carefully and answer the questlons that follow.
Image
(i) In year 2005 which company had the maximum percentage unutilised capacity?
(ii) The TVs produced by Excel form, what percentage of the total production?
Answer
(i) Percentage of unutilised capacity
$=\frac{\text { Production capacity }- \text { Production }}{\text { Production capacity }} \times 100$
$\begin{aligned} \text { Onida } & =\frac{20}{200} \times 100=10 \% \\ \text { Zenith } & =\frac{70}{250} \times 100=28 \% \\ \text { Excel } & =\frac{20}{300} \times 100=6.67 \% \\ \text { Videocon } & =\frac{60}{320} \times 100=18.75 \% \\ \text { BPL } & =\frac{50}{150} \times 100=33.3 \%\end{aligned}$
Hence, BPL had maximum unutilised capacity.
(ii) Total production $=180+180+280+260+100=1000$
$\therefore \text { Required percentage }=\frac{280}{1000} \times 100=28 \%$
View full question & answer
Question 83 Marks
The following data represents the approximate percentage of water in various oceans. Prepare a pie chart for the given data.
Pacific40%
Atlantic30%
Indian20%
Others10%
Answer
Central angle for oceans
$=\left(\frac{\text { Value of the component }}{\text { Sum of the components }} \times 360\right)^{\circ}$
For pacific ocean $=40 \%=\frac{40}{100} \times 360^{\circ}=144^{\circ}$
For atlantic ocean $=30 \%=\frac{30}{100} \times 360^{\circ}=108^{\circ}$
For Indian ocean $=20 \%=\frac{20}{100} \times 360^{\circ}=72^{\circ}$
For others ocean $=10 \%=\frac{10}{100} \times 360^{\circ}=36^{\circ}$
On the basis of above data we can draw the following pie chart :
Image
View full question & answer
Question 93 Marks
The following pie chart represents a total expenditure of ₹ 540000 on different items in constructing a flat in a town. Study the pie chart and answer the questions.
Image
(i) Find the expenditure (in ₹) on bricks.
(ii) How much expenditure on bricks is less than the expenditure on timber (in ₹)?
Answer
(i) Angle made by the expenditure on bricks
$\begin{array}{l}=360^{\circ}-\left(45^{\circ}+100^{\circ}+90^{\circ}+75^{\circ}\right) \\=360^{\circ}-310^{\circ}=50^{\circ}\end{array}$
Thus, the expenditure on bricks
$=\frac{50}{360} \times 540000=$ ₹ $75000$
(ii) Expenditure on bricks $=$ ₹ $75000$
$\text { Expenditure on timber } =\frac{90}{360} \times 540000$
$=\frac{540000}{4}=$ ₹ $135000$
$\therefore$ Difference between expenditure on bricks and expenditure on timber $=135000-75000=$ ₹ $60000$
Hence, the expenditure on bricks is ₹ $60000$ less than expenditure on timber.
View full question & answer
Question 103 Marks
Study the following pie chart carefully to answer the questions.
Percentagewise distribution of teachers who teach six different subject shown below.
Image
If total number of teachers $=1800$
(i) What is the total number of teachers teaching Chemistry, English and Biology?
(ii) What is the difference between the total number of teachers who teach English and Physics together and the total number of teachers who teach Mathematics and Biology together?
Answer
(i) Number of teachers teaching Chemistry
$=\frac{23}{100} \times 1800=414$
Number of teachers teaching English
$=\frac{27}{100} \times 1800=486$
Number of teachers teaching Biology
$=\frac{12}{100} \times 1800=216$
Total numbers of teachers teaching Chemistry, English and Biology $=414+486+216=1116$
(ii) Number of teachers teaching English
$=\frac{27}{100} \times 1800=486$
Number of teachers teaching Physics
$=\frac{17}{100} \times 1800=306$
Number of teachers teaching Mathematics
$=\frac{13}{100} \times 1800=234$
Number of teachers teaching Biology $=216$
$\therefore$ Difference between the total number of teachers teaching English and Physics together and the total number of teachers who teach Mathematics and Biology together
$=(486+306)-(234+216)=792-450=342$
View full question & answer
3 Marks Question - MATHS STD 8 Questions - Vidyadip