Questions

M.C.Q. [1 Marks Each]

Take a timed test

35 questions · auto-graded multiple-choice test.

MCQ 11 Mark
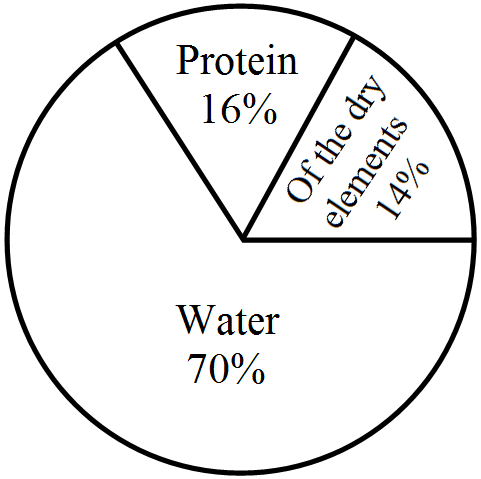
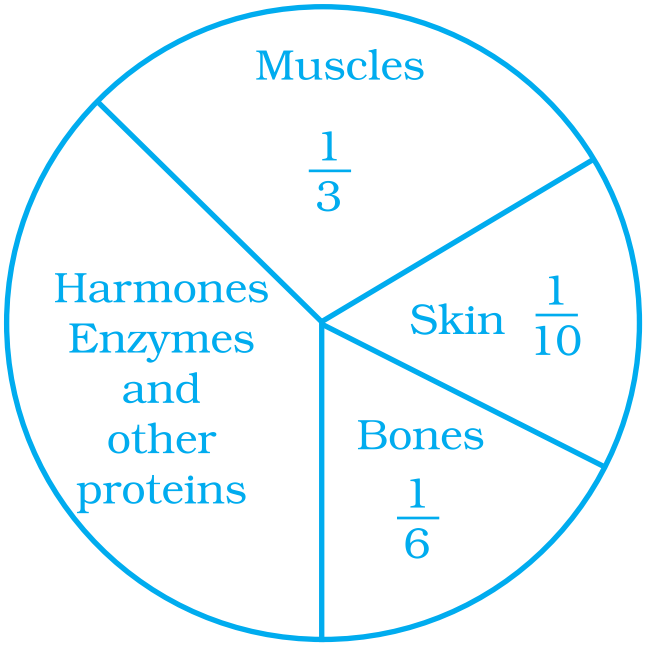
What is the central angle of the sector $($in the above pie chart$)$ representing hormones enzymes and other proteins.
  • A
    $120^\circ$
     
  • $144^\circ$
     
  • C
    $156^\circ$
     
  • D
    $176^\circ$
Answer
Correct option: B.
$144^\circ$
 
The protion representing hormones enzymes and other proteins $=1-\Big(\frac{1}{3}+\frac{1}{10}+\frac{1}{6}\Big)$
$=1-\Big(\frac{20+6+10}{60}\Big)$
$=1-\frac{36}{60}$
$=\frac{60-36}{60}$
$=\frac{2}{5}$
Central angle of the sector representing hormones enzymes and other proteins $=\frac{2}{5}\times360^\circ$
$=144^\circ$
View full question & answer
MCQ 21 Mark
The following pie chart gives the distribution of constituents in the human body. The central angle of the sector showing the distribution of protein and other constituents is:
 
  • $108^\circ$
  • B
    $54^\circ$
  • C
    $30^\circ$
     
  • D
    $216^\circ$
Answer
Correct option: A.
$108^\circ$
Distribution of protein and other constituents in human body $= 16 + 14 = 30\%$
Central angle of the sector showing the distribution of protein and other constituents
$\frac{30}{100}\times360^\circ$
$=108^\circ$
View full question & answer
MCQ 31 Mark
Which of the following is a reasonable conclusion for the given data?
  • A
    $\frac{1}{20}^{\text{th}}$ student voted for blue colour.
  • B
    Green is the least popular colour.
  • C
    The number of students who voted for red colour is two times the number of students who voted for yellow colour.
  • Number of students liking together yellow and green colour is approximately the same as those for red colour.
Answer
Correct option: D.
Number of students liking together yellow and green colour is approximately the same as those for red colour.
Number of students liking together yellow and green colours is $(14 + 20)\%$ i.e. $34\%$, which is approximately the same as those for red $(35\%).$
View full question & answer
MCQ 41 Mark
A diece is tossed two times. The number of possible outcomes is:
  • A
    $12$
  • B
    $24$
  • $36$
  • D
    $30$
Answer
Correct option: C.
$36$
Number of possible outcomes is $36,$
i.e. $(1, 1), (1, 2), (1, 3), (1, 4), (1, 5), (1, 6)$
$(3,1), (3, 2), (3, 3), … (3, 6)$
$(4, 1), (4, 2), … (4, 6)$
$(5, 1), (5, 2), … (5, 6)$
$(6,1), (6, 2), … (6, 6)$
View full question & answer
MCQ 51 Mark
Rahul, Varun and Yash are playing a game of spinning a coloured wheel. Rahul wins if spinner lands on red. Varun wins if spinner lands on blue and Yash wins if it lands on green. Which of the following spinner should be used to make the game fair?
  • A
    $(i)$
  • B
    $(ii)$
  • C
    $(iii)$
  • $(iv)$
Answer
Correct option: D.
$(iv)$


The figure $(iv)$ should be selected to make the game fair as the area occupied by each colour is equal. Hence, the chance of winning for each person is equal.
View full question & answer
MCQ 61 Mark
If $400$ students voted in all, then how many did vote ‘Others’ colour as their favourite?
  • A
    $6$
  • B
    $20$
  • $24$
  • D
    $40$
Answer
Correct option: C.
$24$
If total number of votes $= 400$
Then, number of votes in favour of ‘Others’ $= 6\%$ of $400 =\frac{6}{100}\times400$
$=\frac{3}{50}\times400$
$=24$
View full question & answer
MCQ 71 Mark
In a school only, $3$ out of $5$ students can participate in a competition. What is the probability of the students who do not make it to the competition? Students of a class voted for their favourite colour and a pie chart was prepared based on the data collected. Observe the pie chart given below and answer questions $8 - 10$ based on it.
  • A
    $0.65$
  • $0.4$
  • C
    $0.45$
  • D
    $0.6$
Answer
Correct option: B.
$0.4$
Given, $3$ out of $5$ students can participate in a competition, i.e. $2$ out of $5$ students cannot participate in a competition.
Hence, probability of students who do not make it to competition $\frac{2}{5}=0.4$
Students of a class voted for their favourite colour and a pie chart was prepared based on the data collected.
Observe the pie chart given below and answer the questions $8 - 10$ based on it.
View full question & answer
MCQ 81 Mark
The following pie chart represents the distribution of proteins in parts of a human body. What is the ratio of distribution of proteins in the muscles to that of proteins in the bones?
  • A
    $3 : 1$
  • B
    $1 : 2$
  • C
    $1 : 3$
  • $2 : 1$
Answer
Correct option: D.
$2 : 1$
Distribution of protein in muscles $=\frac{1}{3}$
Distribution of protein in bones $=\frac{1}{6}$
Ratio of distribution of proteins in the muscles to that of proteins in the bones.
$=\frac{1}{3}:\frac{1}{5}$
$=\frac{1}{3}\times\frac{1}{5}$
$=2:1$
View full question & answer
MCQ 91 Mark
A geometric representation showing the relationship between a whole and its parts is a:
  • Pie chart.
  • B
    Histogram.
  • C
    Bar graph.
  • D
    Pictograph.
Answer
Correct option: A.
Pie chart.
Data can also be represented by using a pie chart (circle graph), It shows the relationship between a whole and its parts.
View full question & answer
MCQ 101 Mark
A coin is tossed $200$ times and head appeared $120$ times. The probability of getting a head in this experiment is:
  • A
    $\frac{2}{5}$
  • $\frac{3}{5}$
  • C
    $\frac{1}{5}$
  • D
    $\frac{4}{5}$
Answer
Correct option: B.
$\frac{3}{5}$
Given, head appeared $120$ times, if a coin is tossed $200$ times. Then,
probability of getting a head in this experiment $=\frac{\text{Number of times head appeared}}{\text{Number of times coin is tossed}}$
$=\frac{120}{200}$
$=\frac{3}{5}$
View full question & answer
MCQ 111 Mark
Data represented using circles is known as:
  • A
    Bar graph.
  • B
    Histogram.
  • C
    Pictograph.
  • Pie chart.
Answer
Correct option: D.
Pie chart.
Data represented using circles is known as pie chart.
Note Bar graph Data using bars of different heights in a graphical display is known as bar graph (bar chart).
Histogram Grouped data can be represented by a histogram.
Pictograph Data using pictures and symbols to represent the statistical information is known as pictograph.
View full question & answer
MCQ 121 Mark
A graph showing two sets of data simultaneously is known as:
  • A
    Pictograph.
  • B
    Histogram.
  • C
    Pie chart.
  • Double bar graph.
Answer
Correct option: D.
Double bar graph.
A graph showing two sets of data simultaneously is known as double bar graph.
View full question & answer
MCQ 131 Mark
Rohan and Shalu are playing with $5$ cards as shown in the figure. What is the probability of Rohan picking a card without seeing, that has the number $2$ on it?
  • $\frac{2}{5}$
  • B
    $\frac{1}{5}$
  • C
    $\frac{3}{5}$
  • D
    $\frac{4}{5}$
Answer
Correct option: A.
$\frac{2}{5}$
Total number of cards $= 5$
Number of cards having $2$ on it $= 2$
Probability of Rohan picking a card without seeing, that has the number $2$ on it $\frac{2}{5}$
View full question & answer
MCQ 141 Mark
A coin is tossed $12$ times and the outcomes are observed as shown below:

The chance of occurrence of Head is:
  • A
    $\frac{1}{2}$
  • $\frac{5}{12}$
  • C
    $\frac{7}{12}$
  • D
    $\frac{5}{7}$
Answer
Correct option: B.
$\frac{5}{12}$
Total number of times coin tossed $= 12$
Total number of occurrence of head $= 5$
The chance of occurrence of head $=\frac{\text{Number of times headappeared}}{\text{Number of times a coinis tossed}}$
$=\frac{5}{12}$
View full question & answer
MCQ 151 Mark
Numbers $1$ to $5$ are written on separate slips, i.e one number on one slip and put in a box. Wahida pick a slip from the box without looking at it. What is the probability that the slip bears an odd number?
  • A
    $\frac{1}{5}$
  • B
    $\frac{2}{5}$
  • $\frac{3}{5}$
  • D
    $\frac{4}{5}$
Answer
Correct option: C.
$\frac{3}{5}$
Numbers on the slips are $1, 2, 3, 4$ and $5.$
Odd numbers $= 1, 3, 5$
Number of slips bears an odd number $= 3$
Probability that the slip bears an odd number $=\frac{\text{Number of slipsbearsan odd number}}{\text{Total number of slips}}$
$=\frac{3}{5}$
View full question & answer
MCQ 161 Mark
Size of the class $150-175$ is:
  • A
    $150$
  • B
    $175$
  • $25$
  • D
    $-25$
Answer
Correct option: C.
$25$
Size of the class $150-175$
= Upper limit - Lower
Limit $= 175 - 150 = 25$
View full question & answer
MCQ 171 Mark
A glass jar contains $6$ red, $5$ green, $4$ blue and $5$ yellow marbles of same size. Hari takes out a marble from the jar at random. What is the probability that the chosen marble is of red colour?
  • A
    $\frac{7}{10}$
  • $\frac{3}{10}$
  • C
    $\frac{4}{5}$
  • D
    $\frac{2}{5}$
Answer
Correct option: B.
$\frac{3}{10}$
As, jar contains $6$ red, $5$ green, $4$ blue and $5$ yellow marbles of same size. Then,
Probability that the chosen marble is of red colour $=\frac{\text{Number of red marbles}}{\text{Total number of marbles}}$
$=\frac{6}{6+5+4+5}$
$=\frac{6}{20}$
$=\frac{3}{10}$
View full question & answer
MCQ 181 Mark
A coin is tossed three times. The number of possible outcomes is:
  • A
    $3$
  • B
    $4$
  • C
    $6$
  • $8$
Answer
Correct option: D.
$8$
Number of possible outcomes is $8,$
i.e. $HHH, HHT, HTH, THH, TTH, THT, HTT, TTT.$
View full question & answer
MCQ 191 Mark
A coin is tossed two times. The number of possible outcomes is:
  • A
    $1$
  • B
    $2$
  • C
    $3$
  • $4$
Answer
Correct option: D.
$4$
Number of possible outcomes is $4,$
i.e. $HH, HT, TH, TT.$
View full question & answer
MCQ 201 Mark
Ram put some buttons on the table. There were $4$ blue, $7$ red, $3$ black and $6$ white buttons in all. All of a sudden, a cat jumped on the table and knocked out one button on the floor. What is the probability that the button on the floor is blue?
  • A
    $\frac{7}{20}$
  • B
    $\frac{3}{5}$
  • $\frac{1}{5}$
  • D
    $\frac{1}{4}$
Answer
Correct option: C.
$\frac{1}{5}$
Total number of buttons $= 4 + 7 + 3 + 6 = 20$
Probability that button on the floor is blue $=\frac{\text{Number of blue button}}{\text{Total number of button}}$
$=\frac{4}{20}$
$=\frac{1}{5}$
View full question & answer
MCQ 211 Mark
Tally marks are used to find:
  • A
    Class intervals.
  • B
    Range.
  • Frequency.
  • D
    Upper limit.
Answer
Correct option: C.
Frequency.
Tally marks are used to find the frequency of the observations.
View full question & answer
MCQ 221 Mark
Which colour received $\frac{1}{5}$ of the votes?
  • A
    Red
  • B
    Blue
  • Green
  • D
    Yellow
Answer
Correct option: C.
Green
Blue (25%), i.e. $\frac{25}{100}=\frac{1}{4}$ of votes received by blue.
Red (35%), i.e. $\frac{35}{100}=\frac{7}{20}$ of votes received by red.
Green (20%), i.e. $\frac{20}{100}=\frac{1}{5}$ of votes received by green.
Yellow (14%), i.e $\frac{14}{100}=\frac{7}{50}$ of votes received by yellow.
Others (6%), i.e. $\frac{6}{100}=\frac{3}{50}$ of votes received by others.
Hence, green is the required colour.
View full question & answer
MCQ 231 Mark
Total number of outcomes, when a ball is drawn from a bag which contains $3$ red, $5$ black and $4$ blue balls is:
  • A
    $8$
  • B
    $7$
  • C
    $9$
  • $12$
Answer
Correct option: D.
$12$
Given, a bag contains $3$ red, $5$ black and $4$ blue balls.
Then, total number of outcomes = Total number of balls $= 3 + 5 + 4 = 12$
View full question & answer
MCQ 241 Mark
Upper limit of class interval $75-85$ is:
  • A
    $10$
  • B
    $-10$
  • C
    $75$
  • $85$
Answer
Correct option: D.
$85$
Upper limit of class interval $75-85$ is $85.$
Note: The upper value of class interval is called its upper class limit and lower value of a class interval is called lower class limit.
View full question & answer
MCQ 251 Mark
What is the central angle of the sector $($in the above pie chart$)$ representing skin and bones together?
  • A
    $36^\circ$
  • B
    $60^\circ$
  • C
    $90^\circ$
     
  • $96^\circ$
Answer
Correct option: D.
$96^\circ$
The protion representing skin and together $=\frac{1}{10}+\frac{1}{6}$
$=\frac{3+5}{30}$
$=\frac{8}{30}$
Central angle of the sector representing skin and bones together $=\frac{8}{30}\times360^\circ$
$=96^\circ$
View full question & answer
MCQ 261 Mark
DMonthly salary of a person is Rs. $15000$. The central angle of the sector representing his expenses on food and house rent on a pie chart is $60^\circ$. The amount he spends on food and house rent is:
  • A
    Rs. $5000$
  • Rs. $2500$
  • C
    Rs. $6000$
  • D
    Rs. $9000$
Answer
Correct option: B.
Rs. $2500$
Central angle of the sector representing his expenses on food and house rent on a pie chart $= 60^\circ$.
Part of the monthly salary he is expending on food and house rent $=\frac{1}{6}$
Hence, the amount he spends on food and house rent $=\frac{1}{6}\times$ Monthly salary
$\frac{1}{6}\times15000$
$\text{Rs}.2500$
View full question & answer
MCQ 271 Mark
The height of a rectangle in a histogram shows the:
  • A
    Width of the class.
  • B
    Upper limit of the class.
  • C
    Lower limit of the class.
  • Frequency of the class.
Answer
Correct option: D.
Frequency of the class.
The height of a rectangle in a histogram shows the frequency of the class,
Note: The number of times a particular observation occurs in a given data, is called its frequency.
View full question & answer
MCQ 281 Mark
In a frequency distribution with classes $0-10, 10-20$ etc., the size of the class intervals is $10$. The lower limit of fourth class is:
  • A
    $40$
  • B
    $50$
  • C
    $20$
  • $30$
Answer
Correct option: D.
$30$
Given classes are $0-10$ and $10-20.$
As, the class of given classes is $10$, so the next classes will be $20-30$ and $30-40.$
As, the fourth class is $30-40.$
Hence, the lower limit of fourth class is $30.$
View full question & answer
MCQ 291 Mark
Data collected in a survey shows that $40\%$ of the buyers are interested in buying a particular brand of toothpaste. The central angle of the sector of the pie chart representing this information is:
 
  • A
    $120^\circ$
  • B
    $150^\circ$
  • $144^\circ$
  • D
    $40^\circ$
Answer
Correct option: C.
$144^\circ$
Percentage of buyers who selected the particular brand of toothpaste $= 40\%$
Central angle of the sector of pie chart representing the above information $= 40\%$ of central angle
$=\frac{40}{100}\times360^\circ$
$=144^\circ$
View full question & answer
MCQ 301 Mark
In a pie chart, the total angle at the centre of the circle is:
  • A
    $180^\circ$
  • $360^\circ$
  • C
    $270^\circ$
  • D
    $90^\circ$
Answer
Correct option: B.
$360^\circ$
The total angle at the centre of the circle is $360^\circ$.
View full question & answer
MCQ 311 Mark
Listed below are the temperature in $^\circ C$ for $10$ days. $-6, -8, 0, 3, 2, 0, 1, 5, 4, 4$ What is the range of the data?
  • A
    $8$
  • $13^\circ C$
     
  • C
    $10^\circ C$
     
  • D
    $12^\circ C$
Answer
Correct option: B.
$13^\circ C$
 
Range of data $=$ Maximum temperature $- $ Minimum temperature
$= 5 - (-8) $
$= 5 + 8 $
$=13$
Hence, the range of data is $13^\circ C$.
View full question & answer
MCQ 321 Mark
The range of the data $30, 61, 55, 56, 60, 20, 26, 46, 28, 56$ is:
  • A
    $25$
  • B
    $30$
  • $41$
  • D
    $61$
Answer
Correct option: C.
$41$
Range of data = Maximum value - Minimum value $= 61 - 20 = 41$
View full question & answer
MCQ 331 Mark
In a throw of a dice, the probability of getting the number $7$ is:
  • A
    $\frac{1}{2}$
  • B
    $\frac{1}{6}$
  • C
    $1$
  • $0$
Answer
Correct option: D.
$0$
In a die, there are only $6$ numbers, which are $1, 2, 3, 4, 5$ and $6.$
Hence, there is no possibility of number $7.$
Therefore, probability of getting the number $7$ is $0.$
View full question & answer
MCQ 341 Mark
Which of the following is not a random experiment?
  • A
    Tossing a coin.
  • B
    Rolling a dice.
  • C
    Choosing a card from a deck of $52$ cards.
  • Thowing a stone from a roof of a building.
Answer
Correct option: D.
Thowing a stone from a roof of a building.
Tossing a coin, rolling a die and choosing a card from a deck of $52$ cards are the random experiments, as we don’t have an idea about the output of these experiments. But if we throw a stone from the roof of a building, we know the output, it will fail on the ground.
View full question & answer
MCQ 351 Mark
What is the probability of choosing a vowel from the alphabets?
  • A
    $\frac{21}{26}$
  • $\frac{5}{26}$
  • C
    $\frac{1}{26}$
  • D
    $\frac{3}{26}$
Answer
Correct option: B.
$\frac{5}{26}$
Total number of alphabets $= 26$
Total number of vowels $= 5$
Probability of choosing a vowel from the alphabets $=\frac{\text{Total number of vowels}}{\text{Total number of alphabets}}$
$=\frac{5}{26}$
View full question & answer