Sample QuestionsData Handling questions
One sample from each question group in this chapter. Select any group above to see the full set with answer keys.
Assertion (A): In a histogram, the bases of the rectangles depict class intervals and their heights depict the frequencies.
Reason (R): The width of the rectangles depicts the class size.
- A
Both Assertion (A) and Reason (R) are true and Reason (R) is the correct explanation of Assertion (A).
- ✓
Both Assertion (A) and Reason (R) are true and Reason (R) is not the correct explanation of Assertion (A).
- C
Assertion (A) is true but Reason (R) is false.
- D
Assertion (A) is false but Reason (R) is true.
Answer: B.
View full solution →Assertion (A): In the data 3, 0, 1, 1, 1, 2, 0, 0, 2, 3, 2, 3, 1, 2, 0, 3, all four observations have the same frequency.
Reason (R): A data in which all the observations have different frequencies is called a variable data.
- A
Both Assertion (A) and Reason (R) are true and Reason (R) is the correct explanation of Assertion (A).
- B
Both Assertion (A) and Reason (R) are true and Reason (R) is not the correct explanation of Assertion (A).
- C
Assertion (A) is true but Reason (R) is false.
- D
Assertion (A) is false but Reason (R) is true.
View full solution →Assertion (A): The class mark of the interval 40-45 is 42.5.
Reason (R): The midvalue of a class is called its class mark.
- A
Both Assertion (A) and Reason (R) are true and Reason (R) is the correct explanation of Assertion (A).
- B
Both Assertion (A) and Reason (R) are true and Reason (R) is not the correct explanation of Assertion (A).
- C
Assertion (A) is true but Reason (R) is false.
- D
Assertion (A) is false but Reason (R) is true.
View full solution →Assertion (A): The range of the data 14, 23, 56, 8, 32, 47, 28 is 48.
Reason (R): The difference between the highest and lowest values of the observations in a data is called the range of the data.
- A
Both Assertion (A) and Reason (R) are true and Reason (R) is the correct explanation of Assertion (A).
- B
Both Assertion (A) and Reason (R) are true and Reason (R) is not the correct explanation of Assertion (A).
- C
Assertion (A) is true but Reason (R) is false.
- D
Assertion (A) is false but Reason (R) is true.
View full solution →The weekly wages (in rupees) of 28 workers of a factory are given below: $668, 610, 642, 658, 668, 620, 719, 720, 700, 690, 710, 642, 672, 654, 692, 706, 718, 702, 704, 678, 615, 640, 680, 716, 705, 615, 636, 656$. Construct a frequency table with equal class intervals, taking the first of the class intervals as $610-630$, where $630$ is not included.
View full solution →A dice was thrown 30 times and the following outcomes were noted: 2, 1, 2, 4, 6, 1, 2, 3, 6, 5, 4, 4, 3, 1, 1, 3, 1, 1, 5, 6, 6, 2, 2, 3, 4, 2, 5, 5, 6, 4. Prepare a frequency table.
The number of members in $20$ families are given below: $4, 6, 5, 5, 4, 6, 3, 3, 5, 5, 3, 5, 4, 4, 6, 7, 3, 5, 5, 7$. Prepare a frequency distribution of the data.
View full solution →The following data gives the number of children in $40$ families:
$1, 2, 6, 5, 1, 5, 1, 3, 2, 6, 2, 3, 4, 2, 0, 4, 4, 3, 2, 2, 0, 0, 1, 2, 2, 4, 3, 2, 1, 0, 5, 1, 2, 4, 3, 4, 1, 6, 2, 2$.
Represent it in the form of a frequency distribution.
View full solution →The daily earnings (in rupees) of $24$ stores in a market was recorded as under:
$715, 650, 685, 550, 573, 530, 610, 525, 742, 680, 736, 524, 500, 585, 723, 545, 532, 560, 580, 545, 625, 630, 645, 700.$
Prepare a frequency table taking equal class sizes. One such class is $500-550$, where $550$ is not included.
View full solution →Look at the histogram given below and answer the question that follow:
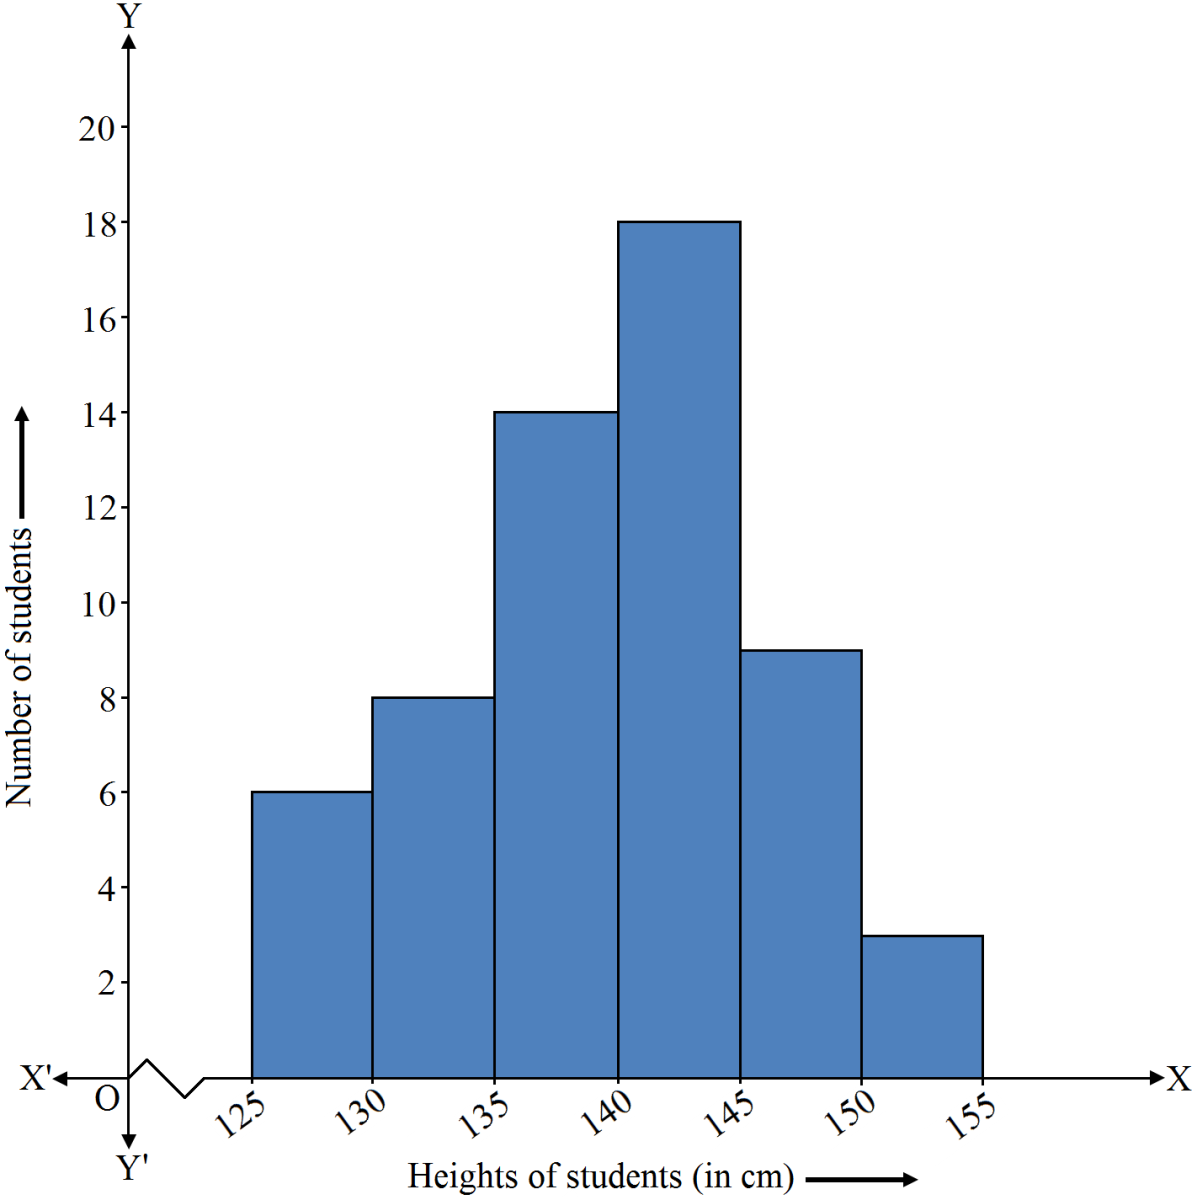
$i.$ How many students have height more than or equal to $135\ cm$ but less than $150\ cm?$
$ii.$ Which class interval has the least number of students?
$iii.$ What is the class size?
$iv.$ How many students have height less than $140\ cm?$ View full solution →The histogram given below shows the number of literate females in the age group of $10$ to $40$ years. Study the histogram carefully and answer the question that follow:
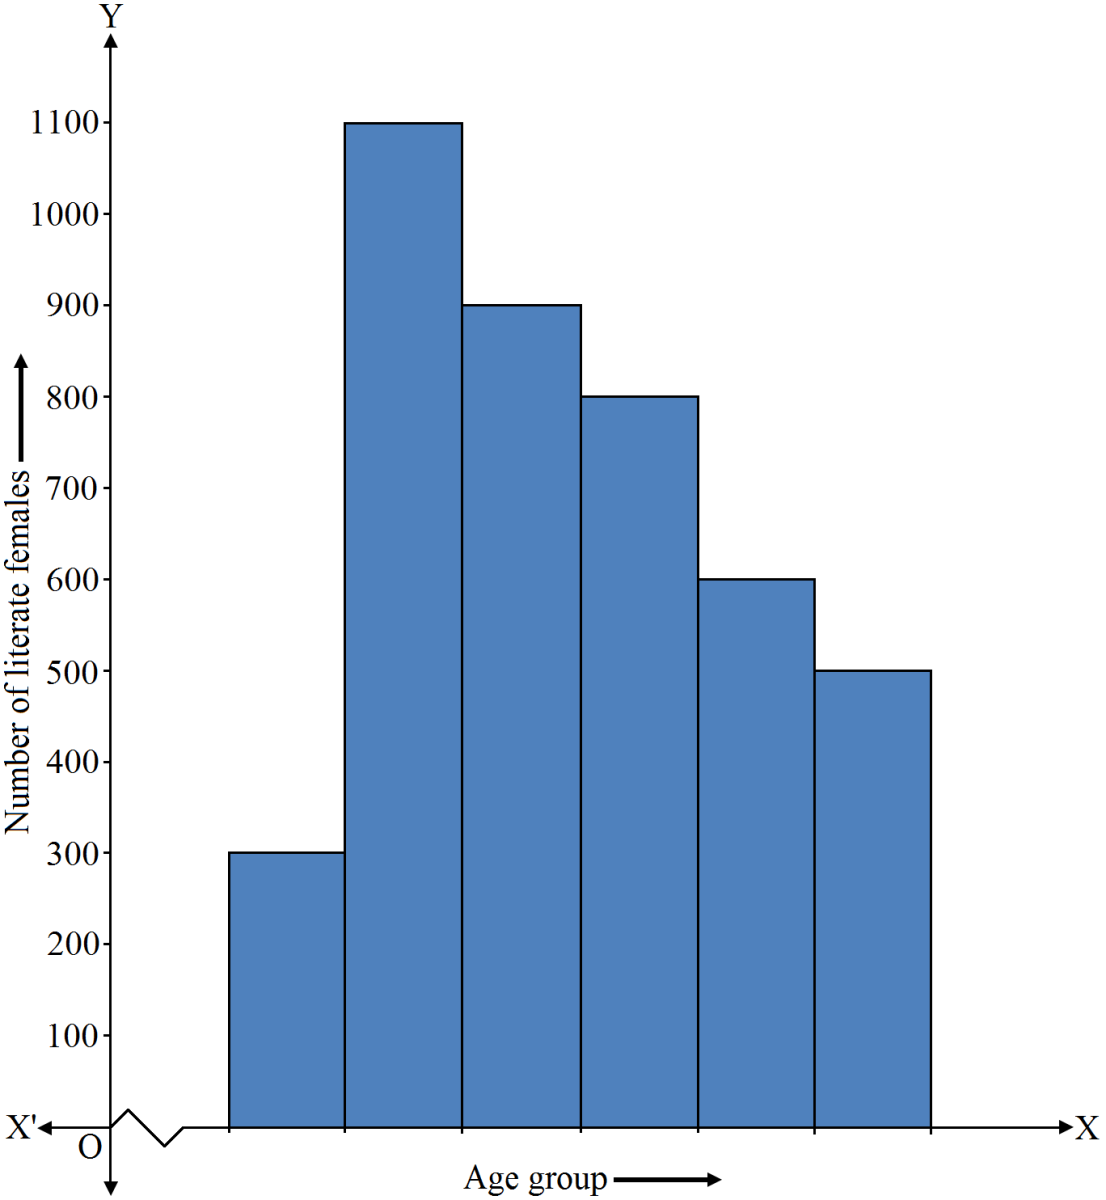
$i.$ Write the classes, assuming that all the classes are of equal width.
$ii.$ What is the class width?
$iii.$ In which age group are the literate females the least?
$iv.$ In which age group is the number of literate females the highest?
Hint. Number of class intervals of equal width $= 6 ($given$)$, class width $=\frac{(40-10)}{6}=5.$ View full solution →Draw a histogram for the frequency distribution of following data:
|
Class interval
|
$8-13$
|
$13-18$
|
$18-23$
|
$23-28$
|
$28-33$
|
$33-38$
|
$38-43$
|
|
Frequency
|
$320$
|
$780$
|
$160$
|
$540$
|
$260$
|
$100$
|
$80$
|
Hint. Take 1 small division $= 10.$ View full solution →Draw a histogram for the frequency distribution of following data:
|
Class interval
|
$20-25$
|
$25-30$
|
$30-35$
|
$35-40$
|
$40-45$
|
$45-50$
|
|
Frequency
|
$30$
|
$24$
|
$52$
|
$28$
|
$46$
|
$10$
|
View full solution →Draw a histogram for the following data:
|
Class interval
|
$600-640$ |
$640-680$ |
$680-720$
|
$720-760$
|
$760-800$
|
$800-840$
|
|
Frequency
|
$18$ |
$45$ |
$153$
|
$288$
|
$171$
|
$63$
|
Hint. Take $1$ small division $= 3.$ View full solution →The marks obtained by 40 students of class VIII in an examination are as under.
24, 3, 11, 18, 13, 10, 8, 1, 6, 4, 6, 17, 9, 7, 13, 9, 19, 13, 6, 24, 3, 17, 24, 20, 16, 14, 22, 14, 2, 8, 22, 9, 14, 19, 25, 8, 4, 19, 18, 17
The teacher asked the students to arrange the data in a grouped tabular form by dividing the data into convenient class intervals, say, 0-5, 5-10, etc.
1. How many class intervals are formed?
(a) 4$\quad$(b) 5$\quad$(c) 6$\quad$(d) 7$\quad$
2. The range of the given data is
(a) 22$\quad$(b) 23$\quad$(c) 24$\quad$(d) 25$\quad$
3. Which class interval depicts the highest frequency?
(a) 5-10$\quad$(b) 10-15$\quad$(c) 15-20$\quad$(d) 20-25$\quad$
4. The frequency corresponding to the class interval having the least frequency is
(a) 1$\quad$(b) 6$\quad$(c) 7$\quad$(d) 8$\quad$
View full solution →