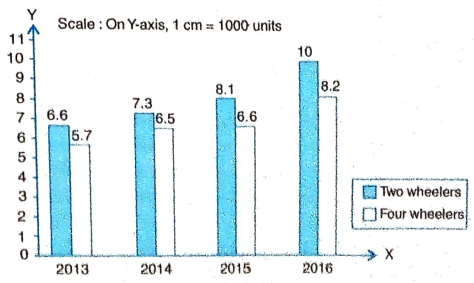
Questions

M.C.Q

🎯

Test yourself on this topic

23 questions · timed · auto-graded

MCQ 11 Mark
Which one of the following is not the graphical representation of statistical data?
  • A
    Bar graph
  • B
    Histogram
  • C
    Frequency polygon
  • Cumulative frequency distribution
Answer
Correct option: D.
Cumulative frequency distribution
d
View full question & answer
MCQ 21 Mark
In the 'less than' type of ogive the cumulative frequency is plotted against
  • A
    the lower limit of the concerned class interval
  • the upper limit of the concerned class interval
  • C
    the mid-value of the concerned class interval
  • D
    any value of the concerned class interval
Answer
Correct option: B.
the upper limit of the concerned class interval
b
View full question & answer
MCQ 31 Mark
In Fig. 17.4, total number of students in the year 2015 was
  • A
    1160
  • 1270
  • C
    1380
  • D
    1490
Answer
Correct option: B.
1270
b
View full question & answer
MCQ 41 Mark
In Fig. 17.4, the ratio between the number of students in the year 2016 and 2017 was
  • A
    107:145
  • B
    127:145
  • 29:36
  • D
    107: 127
Answer
Correct option: C.
29:36
c
View full question & answer
MCQ 51 Mark
In Fig. 17.4, the minimum difference between the number of boys and girls in any year in the given period was
  • A
    90
  • 70
  • C
    50
  • D
    30
Answer
Correct option: B.
70
b
View full question & answer
MCQ 61 Mark
In Fig. 17.4, in which year the number of girls was more than the number of boys?
  • A
    2014
  • B
    2015
  • C
    2016
  • 2017
Answer
Correct option: D.
2017
d
View full question & answer
MCQ 71 Mark
In a histogram the class intervals or the groups are taken along
  • A
    y-axis
  • x-axis
  • C
    both of x-axis and y-axis
  • D
    in between x and y axis
Answer
Correct option: B.
x-axis
b
View full question & answer
MCQ 81 Mark
In a histogram the area of each rectangle is proportional to
  • A
    the class mark of the corresponding class interval
  • B
    the class size of the corresponding class interval
  • frequency of the corresponding class interval
  • D
    cumulative frequency of the corresponding class interval
Answer
Correct option: C.
frequency of the corresponding class interval
c
View full question & answer
MCQ 91 Mark
In a histogram, each class rectangle is constructed with base as
  • A
    frequency
  • class-intervals
  • C
    range
  • D
    size of the class
Answer
Correct option: B.
class-intervals
b
View full question & answer
MCQ 101 Mark
In a frequency distribution, ogives are graphical representation of
  • A
    frequency
  • B
    relative frequency
  • cumulative frequency
  • D
    raw data
Answer
Correct option: C.
cumulative frequency
c
View full question & answer
MCQ 111 Mark
In a bar graph, the height of a bar is proportional to the
  • A
    width of the bar
  • B
    range of the data
  • value of the component
  • D
    number of observations in the data
Answer
Correct option: C.
value of the component
(c) value of the component
The value of a component is directly proportional to the height of corresponding bar.
View full question & answer
MCQ 121 Mark
In a bar graph, the height of a bar is 5 cm and it represents 40 units. The height of the bar representing 56 units is
  • A
    11.2 cm
  • B
    5.6 cm
  • 7 cm
  • D
    8 cm
Answer
Correct option: C.
7 cm
(c) 7 cm
40 units are represented by 5 cm high bar
$\therefore \quad 1$ unit will be represented by $\frac{5}{40} cm$ high bar
$\Rightarrow \quad 56$ units will be represented by $\left(\frac{5}{40} \times 56\right) cm =7 cm$ high bar
View full question & answer
MCQ 131 Mark
In a bar graph, length of a bar is 6.4 cm and it represents 256 units. The number of units represented by a bar of length 5.3 cm is
  • A
    228
  • B
    196
  • 212
  • D
    224
Answer
Correct option: C.
212
(c) 212
6.4 cm represents 256 units
$\therefore \quad 1 cm$ represents $\frac{256}{6.4}$ units $\Rightarrow 5.3 cm$ represents $\frac{256}{6.4} \times 5.3=212$ units
View full question & answer
MCQ 141 Mark
Figure 17.4, shows the bar graph of number of boys and number of girls in a school from 2014 to 2017.
Image
In which year the difference between the number of boys and the number of girls was more
  • A
    2014
  • B
    2015
  • C
    2016
  • 2017
Answer
Correct option: D.
2017
d
View full question & answer
MCQ 151 Mark
Consider the following frequency distribution:
Class interval:5-1010-1515-2525-4545-75
Frequency:61210815

To draw a histogram to represent the above frequency distribution the adjusted frequency for the class 25 - 45 is
  • A
    6
  • B
    5
  • C
    3
  • 2
Answer
Correct option: D.
2
d
View full question & answer
MCQ 161 Mark
  • A
    1500
  • B
    1700
  • 1800
  • D
    2000
Answer
Correct option: C.
1800
(c) 1800
In the year 2013,
Number of two wheelers sold =6600, Number of four wheelers sold = 5700
Difference in sale = 6600 - 5700 = 900
In the year 2014,
Number of two wheelers sold =7300, Number of four wheelers sold = 6500
Difference in sale = 7300 - 6500 = 800
In the year 2015,
Number of two wheelers sold = 8100, Number of four wheelers sold = 6600
Difference in sale = 8100 - 6600 = 1500
In the year 2016,
Number of two wheelers sold =10000, Number of four wheelers sold = 8200
Difference in sale = 10000 - 8200 = 1800
Now, we find that the maximum difference between the sales of two wheelers and four wheelers is 1800 in the year 2016.
View full question & answer
MCQ 181 Mark
  • A
    26000
  • B
    27000
  • C
    31000
  • 32000
Answer
Correct option: D.
32000
(d) 32000
In the year 2013,
Number of two wheelers sold = 6600, Number of four wheelers sold = 5700
Difference in sale = 6600 - 5700 = 900
In the year 2014,
Number of two wheelers sold = 7300, Number of four wheelers sold = 6500
Difference in sale = 7300 - 6500 = 800
In the year 2015,
Number of two wheelers sold = 8100, Number of four wheelers sold = 6600
Difference in sale = 8100 - 6600 = 1500
In the year 2016,
Number of two wheelers sold = 10000, Number of four wheelers sold = 8200
Difference in sale = 10000 - 8200 = 1800
Now, we find that
Total number of two wheelers sold in four years = 6600 + 7300 + 8100 + 10000 = 32000
View full question & answer
MCQ 191 Mark
  • A
    2013
  • 2014
  • C
    2015
  • D
    2016
Answer
Correct option: B.
2014
(b) 2014
In the year 2013,
Number of two wheelers sold $=6600$, Number of four wheelers sold $=5700$
Difference in sale $=6600-5700=900$
In the year 2014 ,
Number of two wheelers sold $=7300$, Number of four wheelers sold $=6500$
Difference in sale $=7300-6500=800$
ln the year 2015 ,
Number of two wheelers sold $=8100$, Number of four wheelers sold $=6600$
Difference in sale $=8100-6600=1500$
In the year 2016 ,
Number of two wheelers sold $=10000$, Number of four wheelers sold $=8200$
Difference in sale $=10000-8200=1800$
Thus, the difference between the sales of two wheelers and four wheelers is least in the year 2014.
View full question & answer
MCQ 201 Mark
A histogram is a pictorial representation of the grouped data in which class intervals and frequency are respectively taken along
  • A
    vertical axis and horizontal axis
  • B
    vertical axis only
  • C
    horizontal axis only
  • horizontal axis and vertical axis
Answer
Correct option: D.
horizontal axis and vertical axis
d
View full question & answer
MCQ 211 Mark
A frequency polygon is constructed by plotting frequency of the class interval and the
  • A
    upper limit of the class
  • B
    lower limit of the class
  • mid value of the class
  • D
    any values of the class
Answer
Correct option: C.
mid value of the class
c
View full question & answer
MCQ 221 Mark
A bar graph is drawn to the scale of $1 cm=x$ units. If the length of a bar representing a quantity of 702 units is 3.6 cm , then $x=$
  • A
    165
  • B
    175
  • C
    185
  • 195
Answer
Correct option: D.
195
(d) 195
We have,
$\begin{array}{ll}& 1 cm=x \text { units } \Rightarrow 3.6 cm=3.6 x \text { units } \\
\therefore \quad & 3.6 x=702 \Rightarrow x=195\end{array}$
View full question & answer
MCQ 231 Mark
A bar graph is drawn to the scale 1 cm = k units, then a bar of length k cm represents
  • A
    1 unit
  • B
    k units
  • C
    2k units
  • $k^2$ units
Answer
Correct option: D.
$k^2$ units
(d) $k^2$ units
Since 1 cm represents $k$ units. Therefore, $k cm$ will represent $k \times k=k^2$ units.
View full question & answer
M.C.Q - Maths STD 9 Questions - Vidyadip