Question 15 Marks
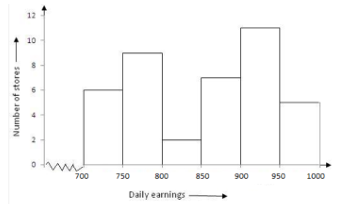
The following table shows the average daily earnings of 40 general stores in a market, during a certain week:
Draw a histogram to represent the above data.
| Daily earning (in rupees) | 700-750 | 750-800 | 800-850 | 850-900 | 900-950 | 950-1000 |
| Number of stores | 6 | 9 | 2 | 7 | 11 | 5 |
Answer
View full question & answer→The following table shows the average daily earnings of 40 general stores in a market, during a certain week:
Clearly, the given frequency distribution is in the exclusive form. We take class intervals, i.e. daily earnings (in ₹) along x-axis and frequencies i.e. number of stores along y-axis. So , we get the required histogram.
Since the scale on X-axis starts at 700, a kink(break) is indicated near the origin to show that the graph is drawn to scale beginning at 700.
| Daily earning (in ₹) | 700-750 | 750-800 | 800-850 | 850-900 | 900-950 | 950-1000 |
| Number of stores | 6 | 9 | 2 | 7 | 11 | 5 |
Since the scale on X-axis starts at 700, a kink(break) is indicated near the origin to show that the graph is drawn to scale beginning at 700.