Question 14 Marks
Read the following text carefully and answer the questions that follow:
Sanjay and his mother visited in a mall. He observes that three shops are situated at $P, Q, R$ as shown in the figure from where they have to purchase things according to their need. Distance between shop $P$ and $Q$ is $8 m$ and between shop $P$ and $R$ is $6 m$.
Considering $O$ as the center of the circles.
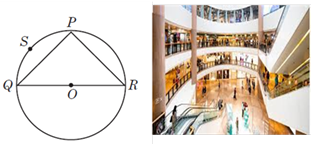
$i$. Find the Measure of $\angle QPR$.
$ii$. Find the radius of the circle.
$iii$. Find the Measure of $\angle QSR$.
OR
Find the area of $\Delta PQR$.
Sanjay and his mother visited in a mall. He observes that three shops are situated at $P, Q, R$ as shown in the figure from where they have to purchase things according to their need. Distance between shop $P$ and $Q$ is $8 m$ and between shop $P$ and $R$ is $6 m$.
Considering $O$ as the center of the circles.
$i$. Find the Measure of $\angle QPR$.
$ii$. Find the radius of the circle.
$iii$. Find the Measure of $\angle QSR$.
OR
Find the area of $\Delta PQR$.
Answer
View full question & answer→$i$. We know that angle in the semicircle $=90^{\circ}$
Here $QR$ is a diameter of circle and $\angle QPR$ is angle in semicircle.
Hence $\angle QPR =90^{\circ}$
$ii$. $\angle QPR =90^{\circ}$
$\Rightarrow QR ^2= PQ ^2+ PR ^2$
$\Rightarrow QR ^2=8^2+6^2$
$\Rightarrow QR =\sqrt{64+36}$
$\Rightarrow QR =10 m$
$iii.$ Measure of $\angle QSR =90^{\circ}$
Angles in the same segment are equal.
$\angle QSR$ and $\angle QPR$ are in the same segment.
OR
Area $\Delta PQR =\frac{1}{2} \times P Q \times P R$
$\Rightarrow$ Area $\Delta PQR =\frac{1}{2} \times 8 \times 6=24 m^2$