Question 13 Marks
Draw the graphs of y = x and y = -x in the same graph. Also find the co-ordinates of the point where the two lines intersect.
Answer
View full question & answer→y=x
We have, $y=x$
Let $x=1: y=1$
Let $x =2: y =2$
Let $x=3: y=3$
Thus, we have the following table :
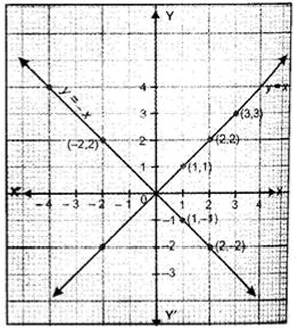
By plotting the points (1, 1), (2, 2) and (3, 3) on the graph paper and joining them by a line, we obtain the graph of y = x.
y = -x
We have, $y=-x$
Let $x=1: y=-1$
Let $x=2: y=-2$
Let $x=-2 : y=-(-2)=2$
Thus, we have the following table exhibiting the abscissa and ordinates of the points of the line represented by the equation y = -x.
Now, plot the points $(1,-1),(2,-2)$ and $(-2,2)$ and join them by a line to obtain the line represented by the equation $y=-x$.
The graphs of the lines $y=x$ and $y=-x$ are shown in figure.
Two lines intersect at $O (0,0)$.
We have, $y=x$
Let $x=1: y=1$
Let $x =2: y =2$
Let $x=3: y=3$
Thus, we have the following table :
| x | 1 | 2 | 2 |
| y | 1 | 2 | 3 |
y = -x
We have, $y=-x$
Let $x=1: y=-1$
Let $x=2: y=-2$
Let $x=-2 : y=-(-2)=2$
Thus, we have the following table exhibiting the abscissa and ordinates of the points of the line represented by the equation y = -x.
| x | 1 | 2 | -2 |
| y | -1 | -2 | 2 |
The graphs of the lines $y=x$ and $y=-x$ are shown in figure.
Two lines intersect at $O (0,0)$.