Question 12 Marks
In there is a histogram depicting daily wages of workers in a factory. Construct the frequency distribution table. 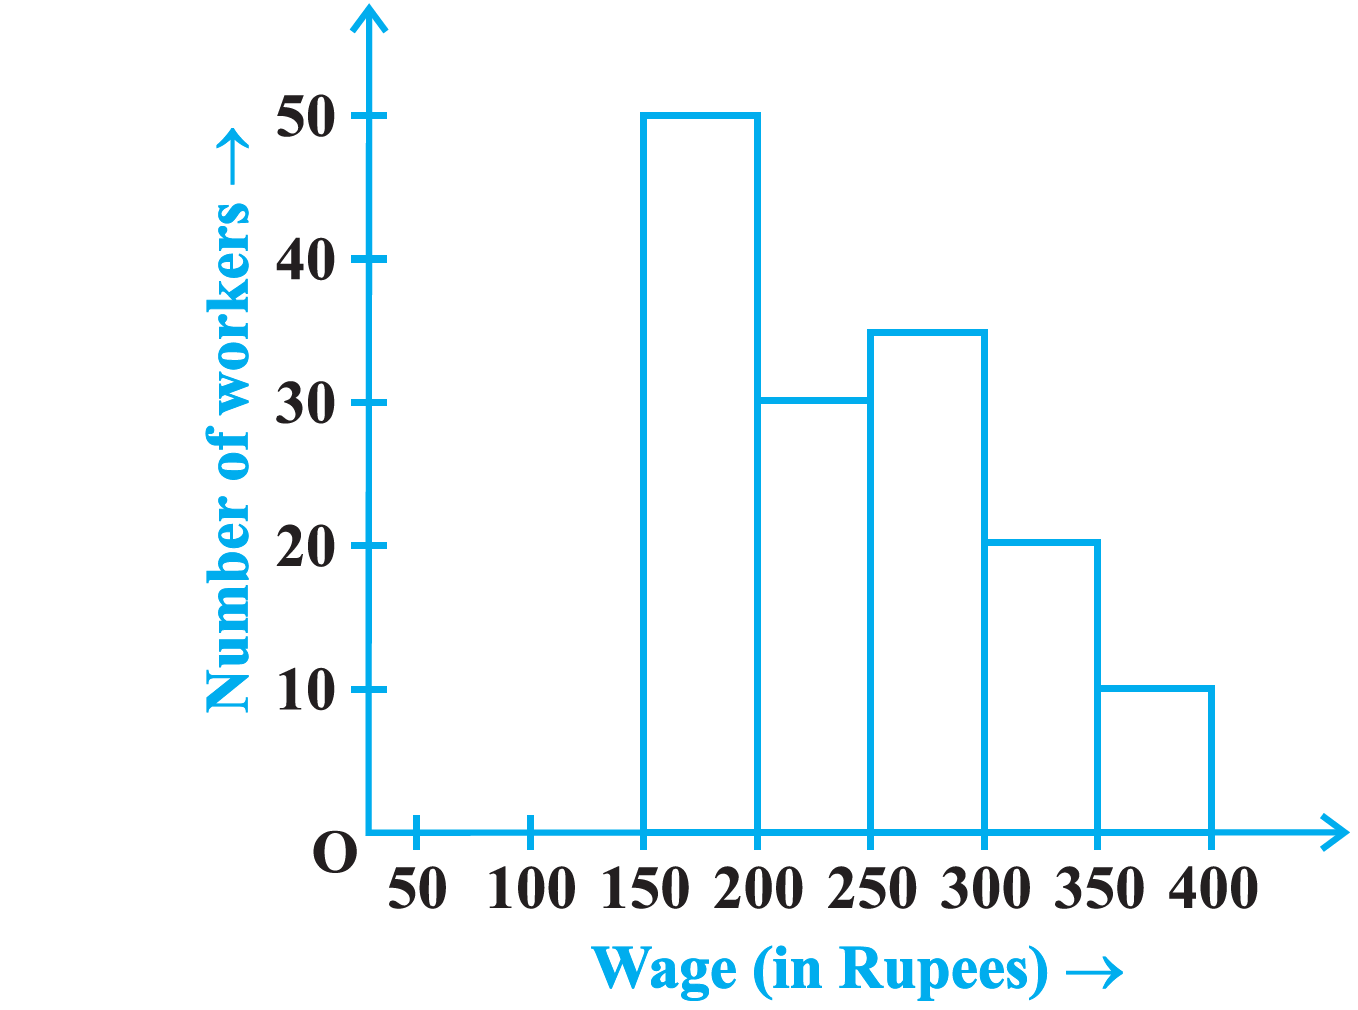
Answer
View full question & answer→|
Class interval
|
Frequency
|
|
$150-200$
$200-250$
$250-300$
$300-350$
$350-400$
|
$50$
$30$
$35$
$20$
$10$
|
|
Total
|
$145$
|