Questions

[4 marks sum]

🎯

Test yourself on this topic

4 questions · timed · auto-graded

Question 14 Marks
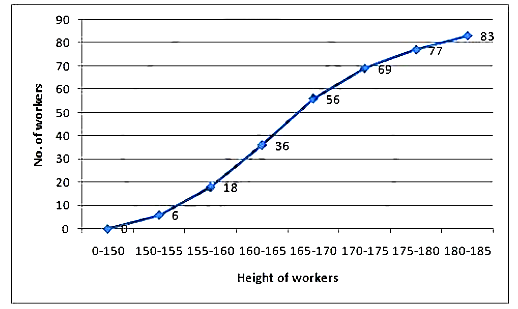
The following table shows the distribution of the heights of a group of factory workers:

Ht. (cm) 150 - 155 155 – 160 160 - 165 165 – 170 170 – 175 175 - 180 180 – 185
No of workers: 6 12 18 20 13 8 6

(i) Determine the cumulative frequencies.
(ii) Draw the ‘less than’ cumulative frequency curve on graph paper. Use 2 cm = 5 cm height on one axis and 2 cm = 10 workers on the other.

View full question & answer
Question 24 Marks
Use graph paper for this question.
The table given below shows the monthly wages of some factory workers
(i) Using the table, calculate the cumulative frequencies of workers
(ii) Draw a cumulative frequency curve.
Use 2 cm = ₹ 500, starting the origin at ₹ 6500 on x-axis, and 2 cm = 10 workers on the y – axis.
Wages (in Rs) 6500-7000 7000-7500 7500-8000 8000-8500 8500-9000 9000-9500 9500-10000
No of workers 10 18 22 25 17 10 8
View full question & answer
[4 marks sum] - Mathematics STD 10 Questions - Vidyadip