Question 15 Marks
40 students enter for a game of shot-put competition. The distance thrown (in metres) is recorded below:
Use a graph paper to draw an ogive for the above distribution.
Use a scale of 2cm = 1 m on one axis and 2cm = 5 students on the other axis.
Hence using your graph find:
(a) the median
(b) upper quartile
(c) the number of students who cover a distance which is above $16 \frac{1}{2} \mathrm{~m}$.
| Distance (in m) | 12 - 13 | 13 - 14 | 14 - 15 | 15 - 16 | 16 - 17 | 17 - 18 | 18 - 19 |
| Number of Students | 3 | 9 | 12 | 9 | 4 | 2 | 1 |
Use a scale of 2cm = 1 m on one axis and 2cm = 5 students on the other axis.
Hence using your graph find:
(a) the median
(b) upper quartile
(c) the number of students who cover a distance which is above $16 \frac{1}{2} \mathrm{~m}$.
Answer
View full question & answer→We first prepare a table as below:
We plot the points $(12,0),(13,3),(14,12),(15,24),(16,33),(17,37),(18,39)$ and $(19,40)$.
Joint these points by a free hand curve to get the ogive as shown.
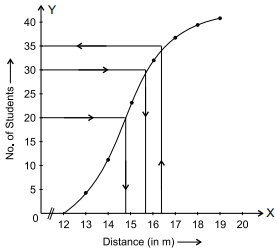
(a) Here, $n=40$
$\Rightarrow \frac{n}{2}=20$
From the graph, median $=14.6 m$
(b) $\frac{3 n}{4}=\frac{3 \times 40}{4}=30$
From the graph $Q _3=15.6 m$
(c) Number of students who cover a distance which is above $16 \frac{1}{2} m=40-35=5$.
| Distance (in m) | No. of students | Cumulative Frequency |
| 12 – 13 | 3 | 3 |
| 13 – 14 | 9 | 12 |
| 14 – 15 | 12 | 24 |
| 15 – 16 | 9 | 33 |
| 16 – 17 | 4 | 37 |
| 17 – 18 | 2 | 39 |
| 18 - 19 | 1 | 40 |
Joint these points by a free hand curve to get the ogive as shown.
(a) Here, $n=40$
$\Rightarrow \frac{n}{2}=20$
From the graph, median $=14.6 m$
(b) $\frac{3 n}{4}=\frac{3 \times 40}{4}=30$
From the graph $Q _3=15.6 m$
(c) Number of students who cover a distance which is above $16 \frac{1}{2} m=40-35=5$.