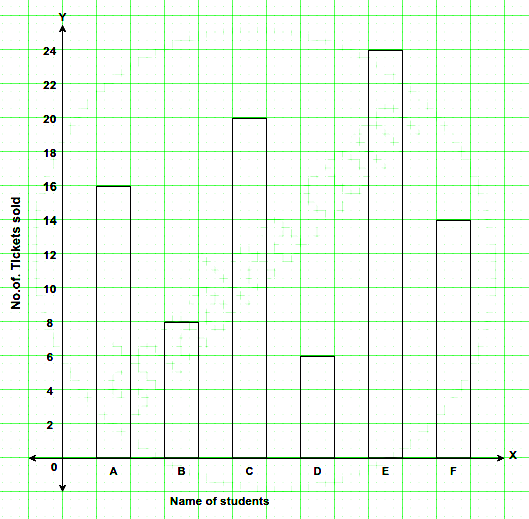
Question 11 MarkThe bar graph drawn below shows the number of tickets sold during a fair by 6 students A, B, C, D, E and F.Using the Bar graph, answer the following question:Who sold the maximum number of tickets?AnswerStudent D sold the maximum number of tickets i.e. 24 tickets.View full question & answer→
Question 21 MarkThe bar graph drawn below shows the number of tickets sold during a fair by 6 students A, B, C, D, E and F.Using the Bar graph, answer the following question:Who sold the least number of tickets?AnswerStudent D sold the least number of tickets, i.e. 7 tickets.View full question & answer→
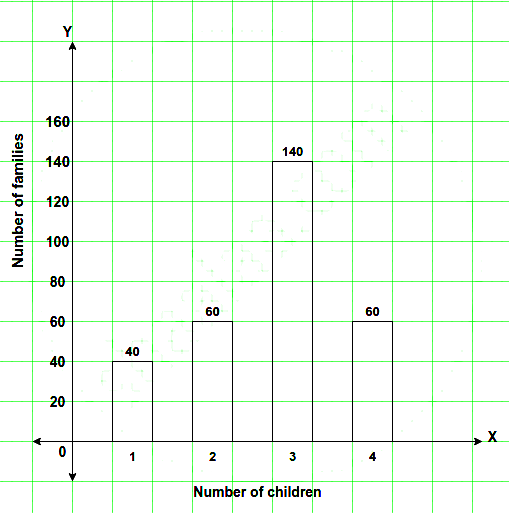
Question 31 MarkIn a survey of 300 families of a colony, the number of children in each family was recorded and the data has been represented by the bar graph, given below:Read the graph carefully and answer the following question:What percentage of families have 4 children?AnswerThe percentage of families having 4 children = `60/300 xx 100 = 20%`View full question & answer→
Question 41 MarkIn a survey of 300 families of a colony, the number of children in each family was recorded and the data has been represented by the bar graph, given below:Read the graph carefully and answer the following question:How many families have no child?AnswerZeroView full question & answer→
Question 51 MarkIn a survey of 300 families of a colony, the number of children in each family was recorded and the data has been represented by the bar graph, given below:Read the graph carefully and answer the following question:How many families have 2 children each?Answer60 families have 2 children each.View full question & answer→
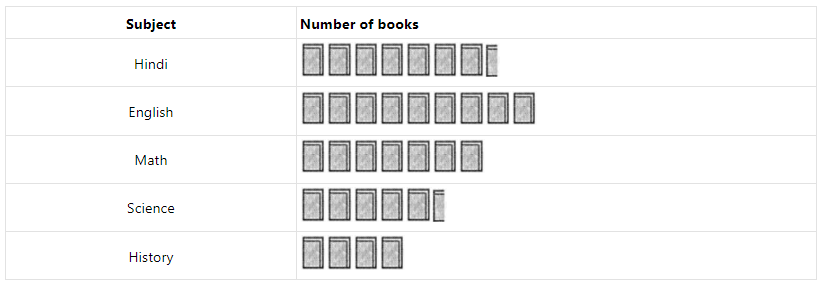
Question 61 MarkThe following pictograph shows different subject books which are kept in a school library.Taking symbol of one book = 50 books, find:Which books are maximum in number?AnswerEnglish books are maximum in number = 500 x 9 = 450 books.View full question & answer→
Question 71 MarkThe following pictograph shows different subject books which are kept in a school library. Taking symbol of one book = 50 books, find:How many Science books are there in the library?AnswerThere are 50 x 5.5 = 275 Science books in the library.View full question & answer→
Question 81 MarkThe following pictograph shows different subject books which are kept in a school library. Taking symbol of one book = 50 books, find:How many History books are there in the library?AnswerThere are 50 x 4 = 200 History books in the library.View full question & answer→
Question 91 MarkThe following pictograph shows the number of watches manufactured by a factory, in a particular weeks. Scale: = 100 watchesFind the total number of watches manufactured in the whole week?AnswerTotal no. of watches manufactured in the whole week= 100 x 42.5 = 4250 watchesView full question & answer→
Question 101 MarkThe following pictograph shows the number of watches manufactured by a factory, in a particular weeks. Scale: = 100 watchesFind on which day was the least number of watches manufactured?AnswerOn Friday least no. of watches manufactured by= 100 x 5 = 500 watchesView full question & answer→
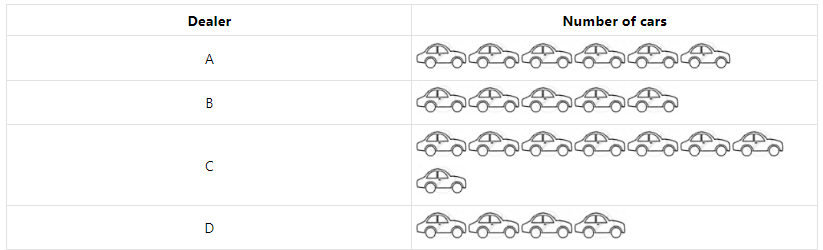
Question 111 MarkThe following pictograph shows the number of cars sold by four dealers A, B, C and D in a city. Scale: = 50 cars. Using the pictograph, drawn above, answer the following questions:What is the total number of cars sold by all the dealers?AnswerNo. of cars = 23Scale = 50 cars∴ Total no. of cars = 23 x 50 = 1150 carsView full question & answer→
Question 121 MarkDefine the following term: Frequency of an observation AnswerFrequency of an observation is the number of times a certain value or a class of values occurs.View full question & answer→
Question 131 MarkDefine: dataAnswerData: The word data means information in the form of numerical figures.View full question & answer→
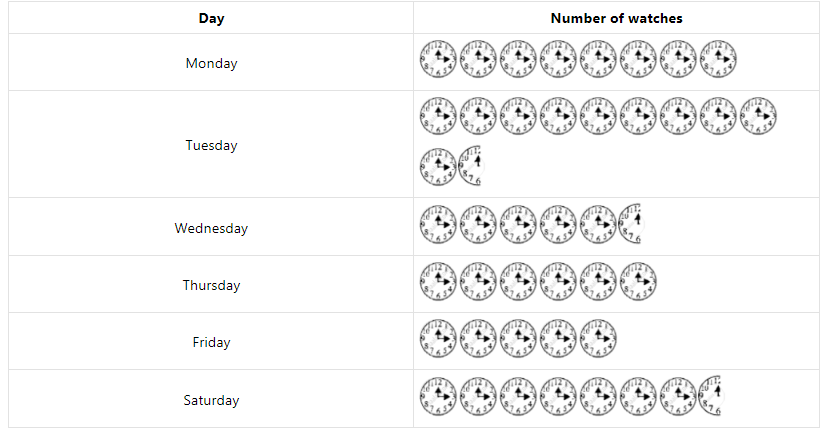
 = 100 watches
 = 50 cars.