Question 12 Marks
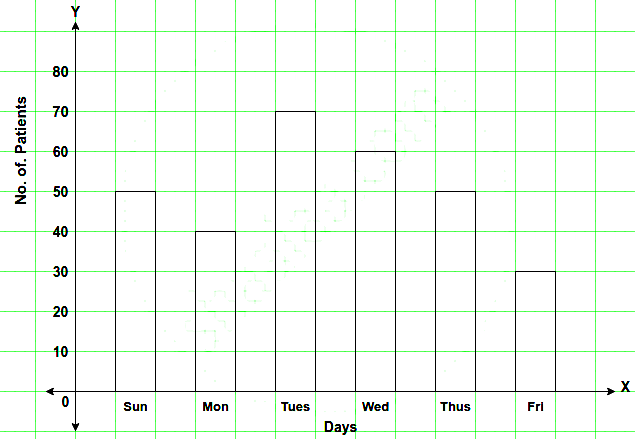
The column graph, given above, shows the number of patients, examined by Dr. V.K. Bansal, on different days of a particular week.
Use the graph to answer the following:
On which days were equal number or patients examined?
Use the graph to answer the following:
On which days were equal number or patients examined?
 = 50 cars.
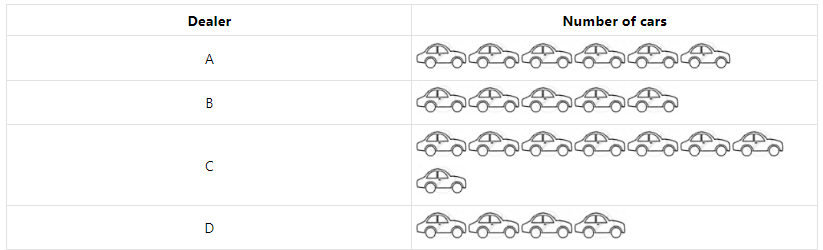 Using the pictograph, drawn above, answer the following questions: