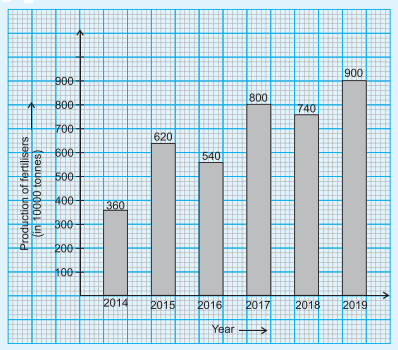
Question 14 MarksThe following pictograph represents the production of fertilisers (in 10000 tonnes) by company X from 2014 to 2019. Study the above information and answer the questions given below : Q.1. The ratio of the highest to the lowest production is : (a) 5 : 2 $\quad$(b) 7 : 2 $\quad$(c) 3 : 2 $\quad$(d) 5 : 1 Q.2. The percentage increase in production of fertilisers in 2016 compared to that in the year 2014, is : (a) 60% $\quad$(b) 50% $\quad$(c) 40% $\quad$(d) 70% Q.3. The percentage decrease in production of fertilisers from 2017 to 2018, is : (a) 5% $\quad$(b) 10% $\quad$(c) 7.5% $\quad$(d) 12.5% Q.4. The number of years for which the production of fertilisers was more than the average production of the given years, is : (a) 3 $\quad$(b) 4 $\quad$(c) 1 $\quad$(d) 2Answer1. (A) 5 : 2$\qquad$2. (B) 50 %$\qquad$3. (C) 7.5 %$\qquad$4. (A) 3View full question & answer→
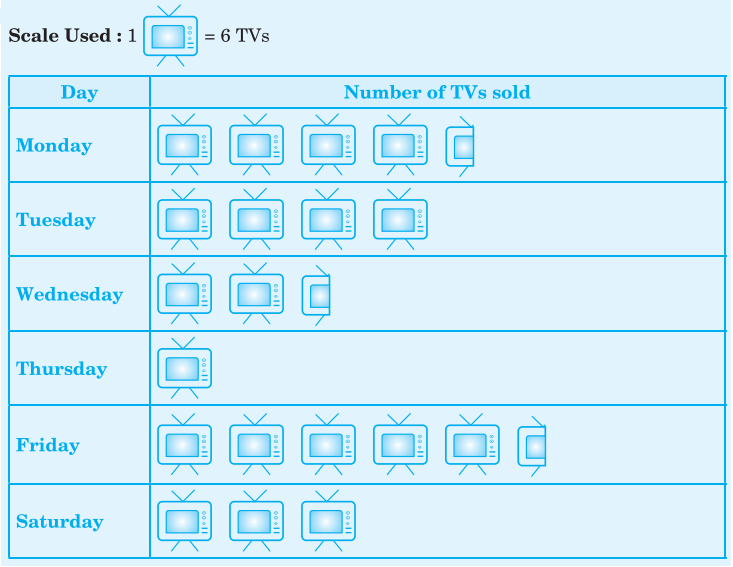
Question 24 MarksThe following pictograph depicts the number of TVs sold by an electronics shop during a certain week :Look at the pictograph and answer the questions given below : Q.1. The maximum number of TVs were sold on : (a) Saturday $\quad$(b) Tuesday $\quad$(c) Friday $\quad$(d) Monday Q.2. By what percent is the maximum number of TVs sold in a day geater than the minimum number of TVs sold in a day? (a) 450% $\quad$(b) 500% $\quad$(c) 400% $\quad$(d) 550% Q.3. The ratio of the number of TVs sold on Monday to that sold on is 3 : 2. (a) Thursday $\quad$(b) Tuesday $\quad$(c) Wednesday $\quad$(d) Saturday Q.4. The percentage decline in sale from Tuesday to Wednesday is : (a) 20% $\quad$(b) 37.5% $\quad$(c) 35% $\quad$(d) 25%Answer1. (C) Friday$\qquad$2. (A) 450 %$\qquad$3. (D) Saturday$\qquad$4. (B) 37.5 %View full question & answer→