Question 15 Marks
For the following data, draw a pie graph.
| Subject | Hindi | English | Maths | Science | Social Study |
| Marks as percent | $60$ | $45$ | $42$ | $48$ | $75$ |
Answer
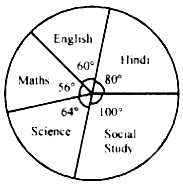
View full question & answer→$\because 60+45+42+48+75=270$
$\therefore$ Central angle for Hindi $=\frac{60}{270} \times 360^{\circ}=80^{\circ}$
Central angle for English $=\frac{45}{270} \times 360^{\circ}=60^{\circ}$
Central angle for Maths $=\frac{42}{270} \times 360^{\circ}=56^{\circ}$
Central angle for Science $=\frac{48}{270} \times 360^{\circ}=64^{\circ}$
and Central angle for Social study $=\frac{75}{270} \times 360^{\circ}=100^{\circ}$