Question 13 Marks
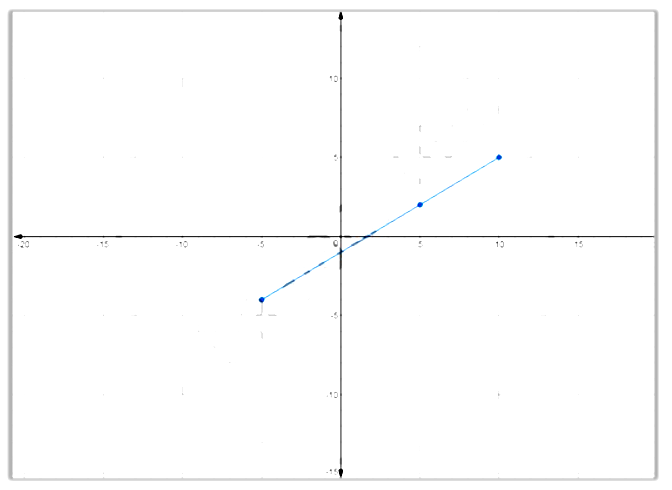
Draw a graph of each of the following equations: $y=\frac{3}{5}, x-1$
Answer
View full question & answer→$y=\frac{3}{5}, x-1$
When $x=5, y=\frac{3}{5}(5)-1=2$
When $x=-5, y=\frac{3}{5}(-5)-1=-4$
When $x=10, y=\frac{3}{5}(10)-1=5$
Plotting the points $(5, 2), (-5, -4)$ and $(10, 5)$, we get a line $AB$ as shown in the figure.
When $x=5, y=\frac{3}{5}(5)-1=2$
When $x=-5, y=\frac{3}{5}(-5)-1=-4$
When $x=10, y=\frac{3}{5}(10)-1=5$
| $x$ | $5$ | $-5$ | $10$ |
| $y$ | $2$ | $-4$ | $5$ |