Question 13 Marks
The following is the distribution of weights $($in $kg)$ of $52$ persons:
|
Weight in kg
|
Persons
|
|
$30-40$
|
$10$
|
|
$40-50$
|
$15$
|
|
$50-60$
|
$17$
|
|
$60-70$
|
$6$
|
|
$70-80$
|
$4$
|
$i.$ What is the lower limit of class $50-60?$
$ii.$ Find the class marks of the classes $40-50, 50-60.$
$iii.$ What is the class size?
Answer$i.$ The lower limit of the class $50-60$ is $50.$
$ii.$ Class mark for the class $40-50:$
$\frac{40+50}{2}$
$=\frac{90}{2}$
$=45$
Again, class mark for the class $50-60:$
$\frac{50+60}{2}$
$=\frac{110}{2}$
$=55$
$iii.$ Here the class size is $40-30,$ i.e. $10.$
View full question & answer→Question 23 Marks
The marks obtained by $40$ students of class VIII in an examination are given below: $16, 17, 18, 3, 7, 23, 18, 13, 10, 21, 7, 1, 13,21, 13, 15, 19, 24, 16, 3, 23, 5, 12, 18, 8, 12, 6, 8, 16, 5, 3, 5, 0, 7,$ $ 9, 12, 20,10, 2, 23.$ Divide the data into five groups, namely $0-5, 5-10, 10-15, 15-20$ and $20-25$ and prepare a grouped frequency table.
AnswerThe frequency table for the marks of $40$ students of class $VIII$ in an examination is given below: 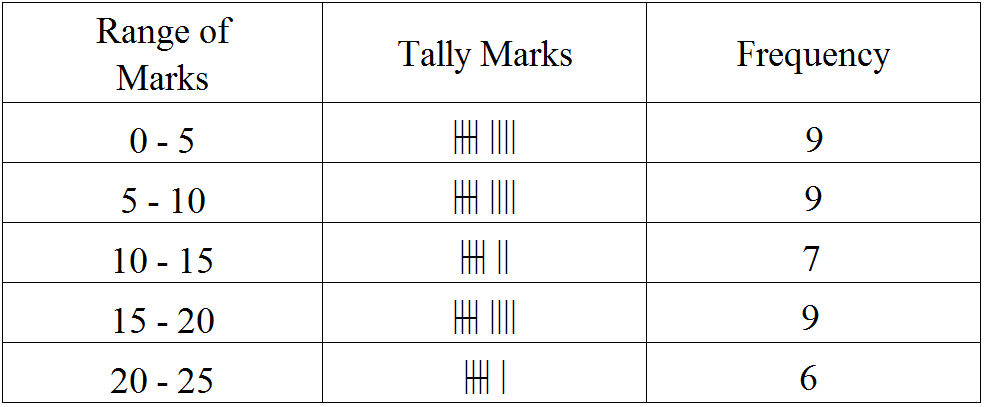
View full question & answer→Question 33 Marks
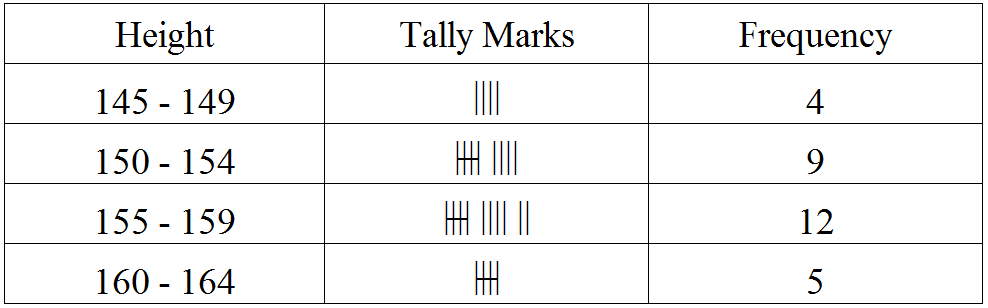
The heights (in cm) of $30$ students of class $VIII$ are given below: $155, 158, 154, 158, 160, 148, 149, 150, 153, 159, 161, 148, 157, 153, 157, 162, 159, 151, 154, 156, 152, $ $156, 160, 152, 147,155, 163, 155, 157, 153.$ Prepare a frequency distribution table with $160-164$ as one of the class intervals.
AnswerThe frequency table is given below:
View full question & answer→Question 43 Marks
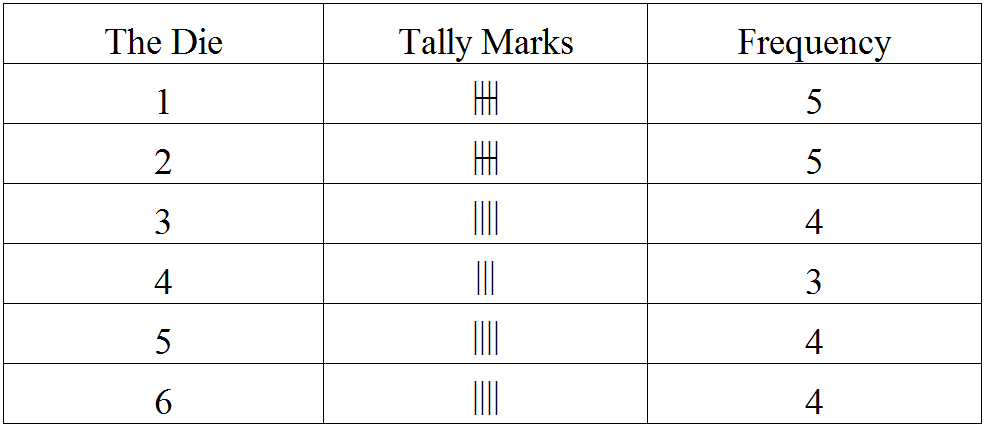
A die was thrown $25$ times and following scores were obtained: $1, 5, 2, 4, 3, 6, 1, 4, 2, 5, 1, 6, 2, 6, 3, 5, 4, 1, 3, 2, 3, 6, 1, 5, 2.$ Prepare a frequency table of the scores.
AnswerThe frequency of the scores of the die is shown below:
View full question & answer→Question 53 Marks
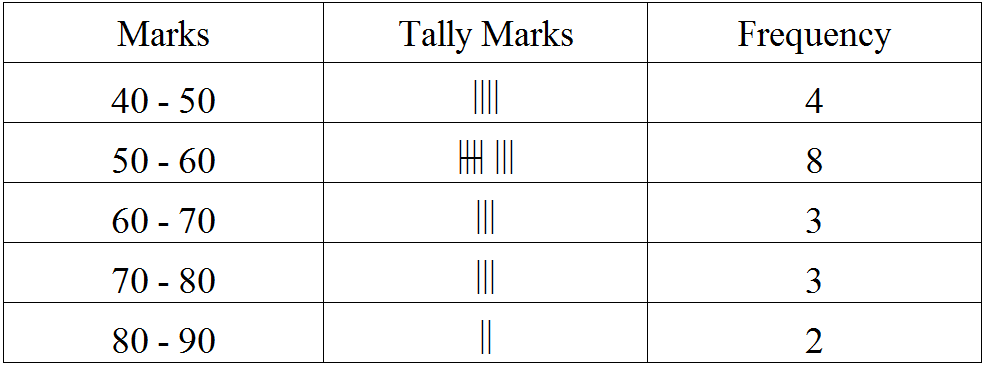
The marks scored by $20$ students in a test are given below: $54, 42, 68, 56, 62, 71, 78, 51, 72, 53, 44, 58, 47, 64, 41, 57, 89, 53, 84, 57.$ Complete the following frequency table:
| (Marks in class intervals) |
Tally marks |
Frequency (no. of children) |
| $40-50$ |
|
|
| $50-60$ |
|
|
| $60-70$ |
|
|
| $70-80$ |
|
|
| $80-90$ |
|
|
What is the class interval in which the greatest frequency occurs$?$ AnswerThe frequency table can be completed as follows:
View full question & answer→Question 63 Marks
In a study of number of accidents per day, the observations for $30$ days were obtained as follows: $6, 3, 5, 6, 4, 3, 2, 5, 4, 2, 4, 2, 1, 2, 2, 0, 5, 4, 6, 1, 6, 0, 5, 3, 6, 1, 5, 5, 2, 6.$ Prepare a frequency distribution table.
AnswerThe frequency table for the number of accidents per day for a period of $30$ days is given below: 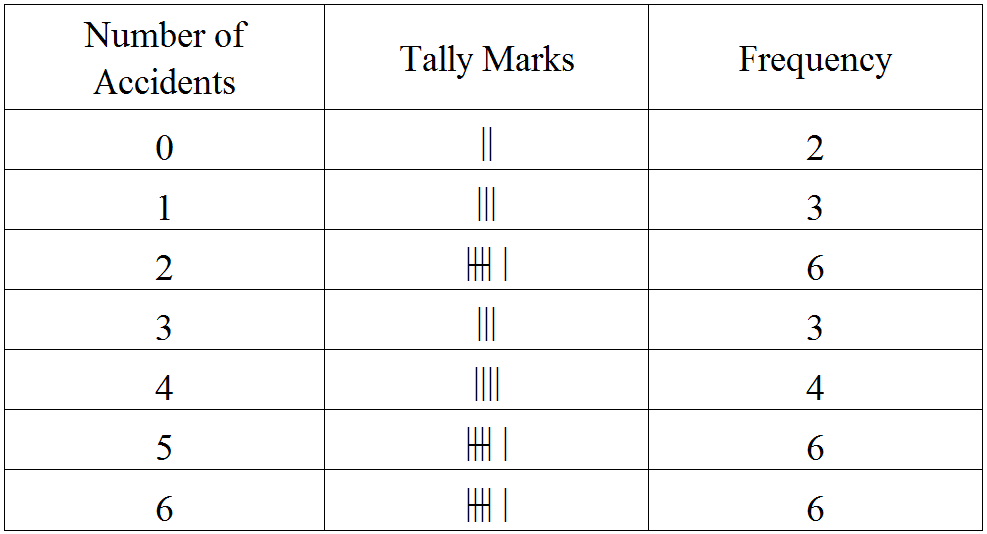
View full question & answer→Question 73 Marks
Prepare a frequency table of the following ages (in years) of $30$ students of class VIII in your school: $13, 14, 13, 12, 14, 13, 14, 15, 13, 14, 13, 14, 16, 12, 14, 13, 14, 15, 16, 13, 14, 13, 12, 17, 13, 12, 13, 13, 13, 14.$
AnswerThe frequency table of the ages of $30$ students of class VII in the school is given below: 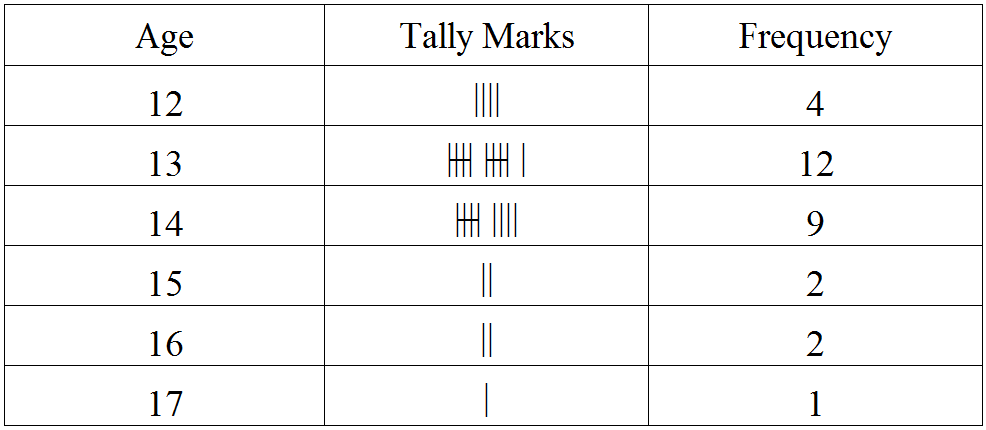
View full question & answer→Question 83 Marks
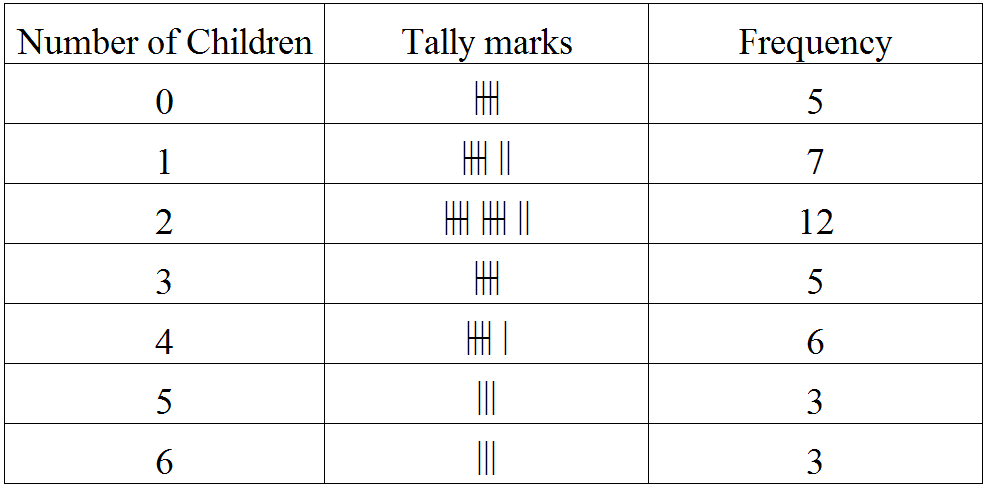
Following data gives the number of children in $40$ families: $1, 2, 6, 5, 1, 5, 1, 3, 2, 6, 2, 3, 4, 2, 0, 0, 4, 4, 3, 2, 2, 0, 0, 1, 2, 2, 4, 3, 2, 1, 0, 5, 1, 2, 4, 3, 4, 1, 6, 2, 2.$ Represent it in the form of a frequency distribution.
AnswerThe data can be put in the form of frequency distribution in the following manner:
View full question & answer→Question 93 Marks
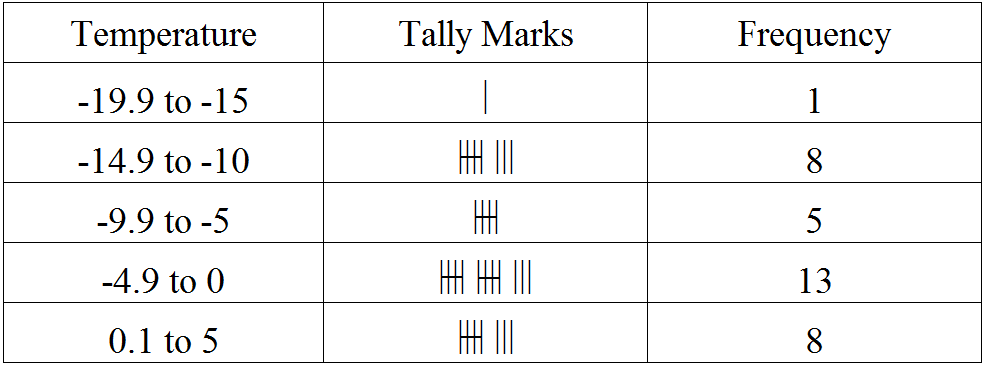
The daily minimum temperatures in degrees Celsius recorded in a certain Arctic region are as follows: $-12.5, -10.8, -18.6, -8.4, -10.8, -4.2, -4.8, -6.7, -13.2, -11.8, -2.3, 1.2, 2.6, 0,$ $-2.4, 0, 3.2, 2.7, 3.4, 0, -2.4, -2.4, 0, 3.2, 2.7, 3.4, 0, -2.4, -5.8, -8.9, -14.6, -12.3, -11.5, -7.8, -2.9.$ Represent them as frequency distribution table taking $-19.9$ to $-015$ as the first class interval.
AnswerThe frequency table of the daily minimum temperatures is given below:
View full question & answer→Question 103 Marks
Prepare a frequency table of the following scores obtained by $50$ students in a test: $42, 51, 21, 42, 37, 37, 42, 49, 38, 52, 7, 33, 17, 44, 39, 7, 14, 27, 39, 42, 42, 62, 37, 39, 67, 51, 53, 53, 59, 41, 29, 38,$ $ 27, 31, 64, 19, 53,51, 22, 61, 42, 39, 59, 47, 33, 34, 16, 37, 57, 43.$
AnswerThe frequency table of $50$ students is given below:
|
Marks
|
Number of Students
|
Marks
|
Number of Students
|
Marks
|
Number of Students
|
|
$7$
|
$2$
|
$33$
|
$2$
|
$49$
|
$1$
|
|
$14$
|
$1$
|
$34$
|
$1$
|
$51$
|
$3$
|
|
$16$
|
$1$
|
$37$
|
$4$
|
$52$
|
$1$
|
|
$17$
|
$1$
|
$38$
|
$2$
|
$53$
|
$3$
|
|
$19$
|
$1$
|
$39$
|
$4$
|
$54$
|
$1$
|
|
$21$
|
$1$
|
$41$
|
$1$
|
$57$
|
$1$
|
|
$22$
|
$1$
|
$42$
|
$6$
|
$59$
|
$2$
|
|
$27$
|
$2$
|
$43$
|
$1$
|
$61$
|
$1$
|
|
$29$
|
$1$
|
$44$
|
$1$
|
$62$
|
$1$
|
|
$31$
|
$1$
|
$47$
|
$1$
|
$67$
|
$1$
|
View full question & answer→