Question 75 Marks
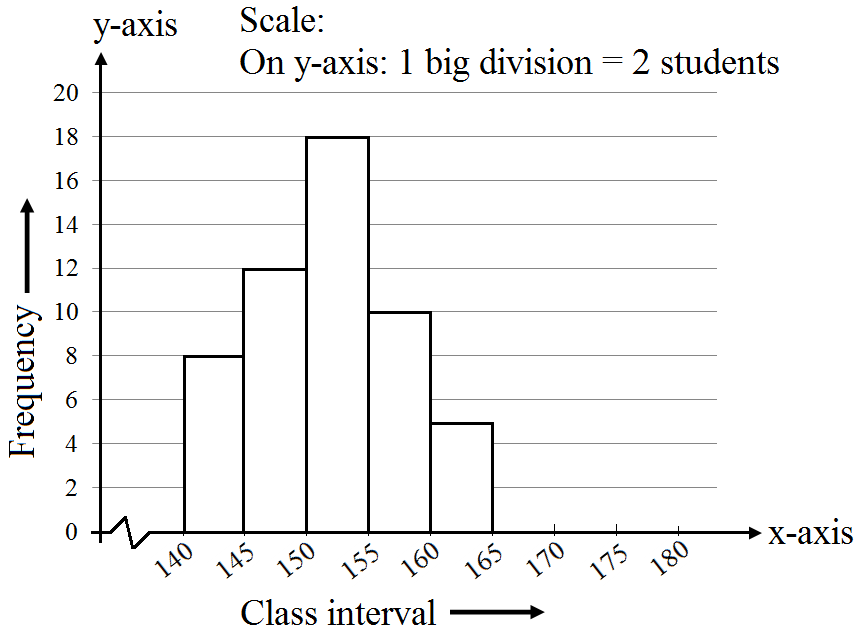
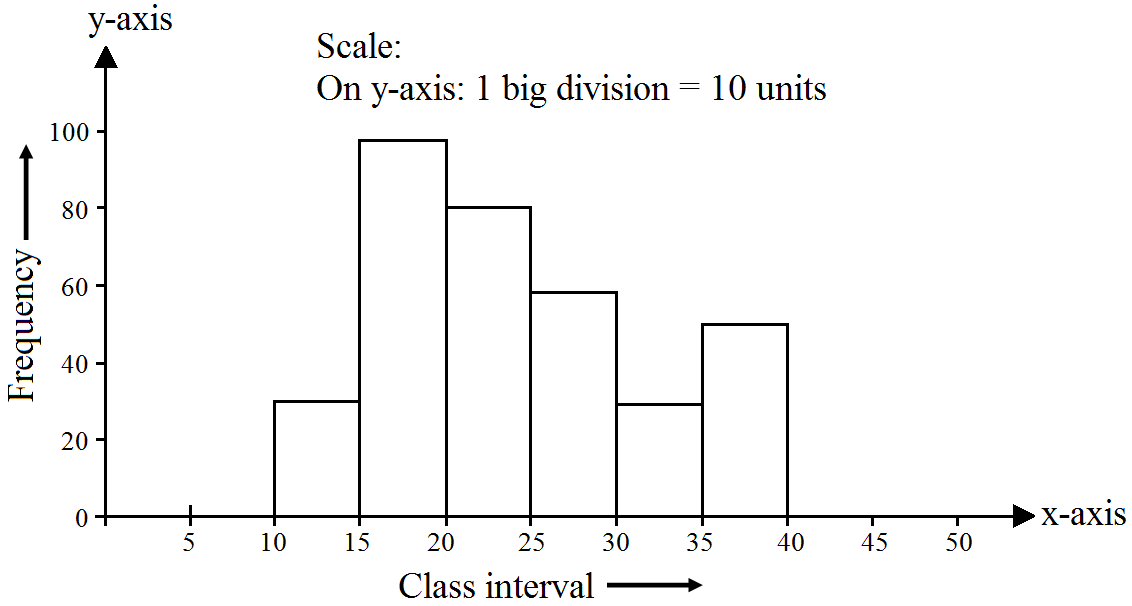
In a hypothetical sample of $20$ people the amounts of money with them were found to be as follows: $114, 108, 100, 98, 101, 109, 117, 119, 126, 131, 136, 143, 156, 169, 182, 195, 207, 219, 235, 118$. Draw the histogram of the frequency distribution (taking one of the class intervals as 50-100).
AnswerWe first prepare the frequency table for the class intervals $50-100, 100-150, ........., 200-250,$ as shown below:
|
Money
|
Tally Amount
|
Frequency
|
|
$50-100$
|
$98$
|
$1$
|
|
$100-150$
|
$114, 108, 100, 101, 109, 117, 119, 126, 131, 136, 143, 118$
|
$12$
|
|
$150-200$
|
$156, 169, 182, 195$
|
$4$
|
|
$200-250$
|
$207, 219, 235$
|
$3$
|
The class limits are represented along the $x$-axis and the frequencies along the $y$-axis on a suitable scale. Taking the class intervals as bases and the corresponding frequencies as heights, the rectangles can be drawn to obtain the histogram of the given frequency distribution. The histogram is shown below: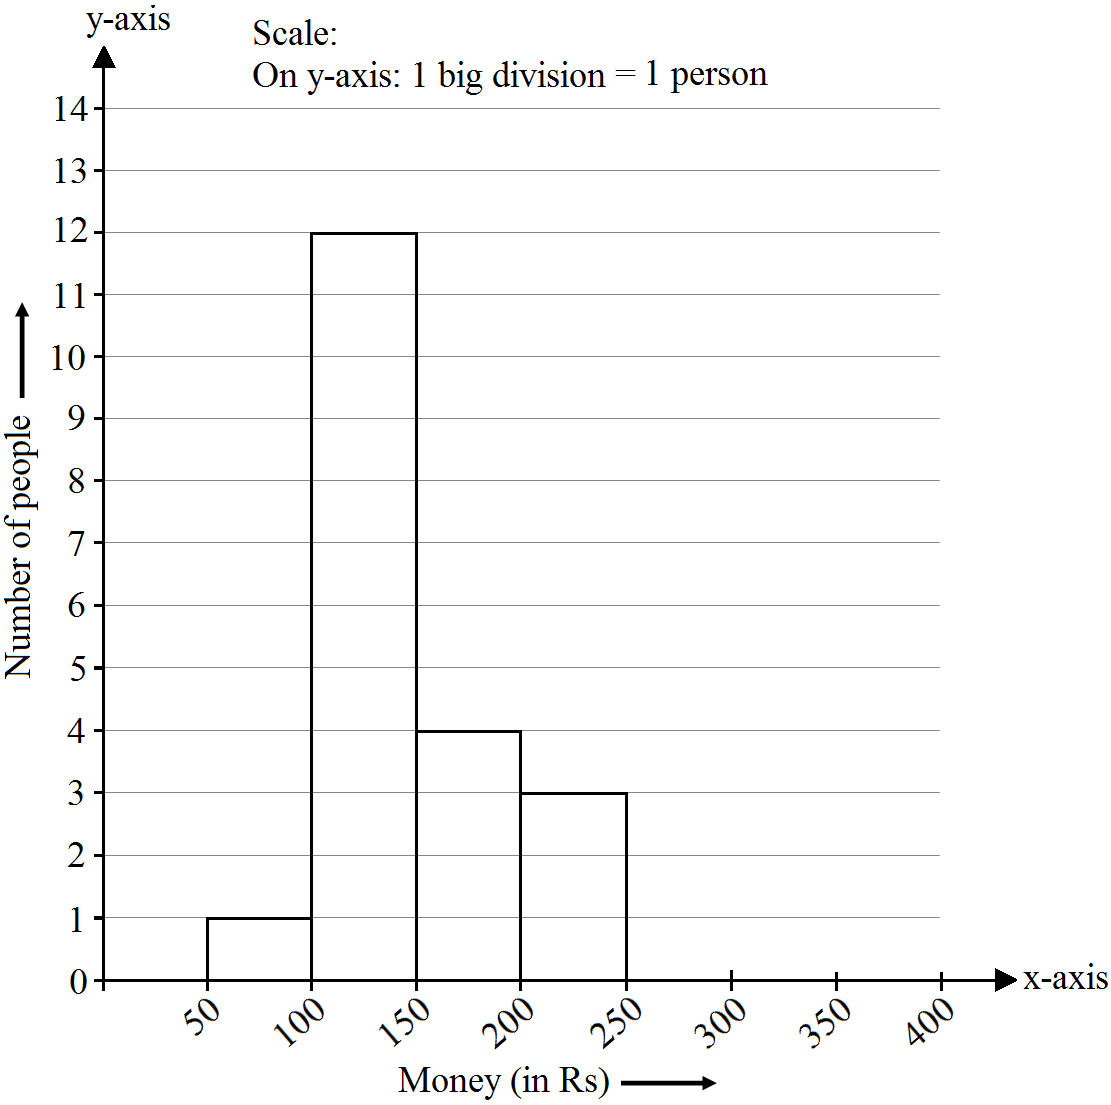
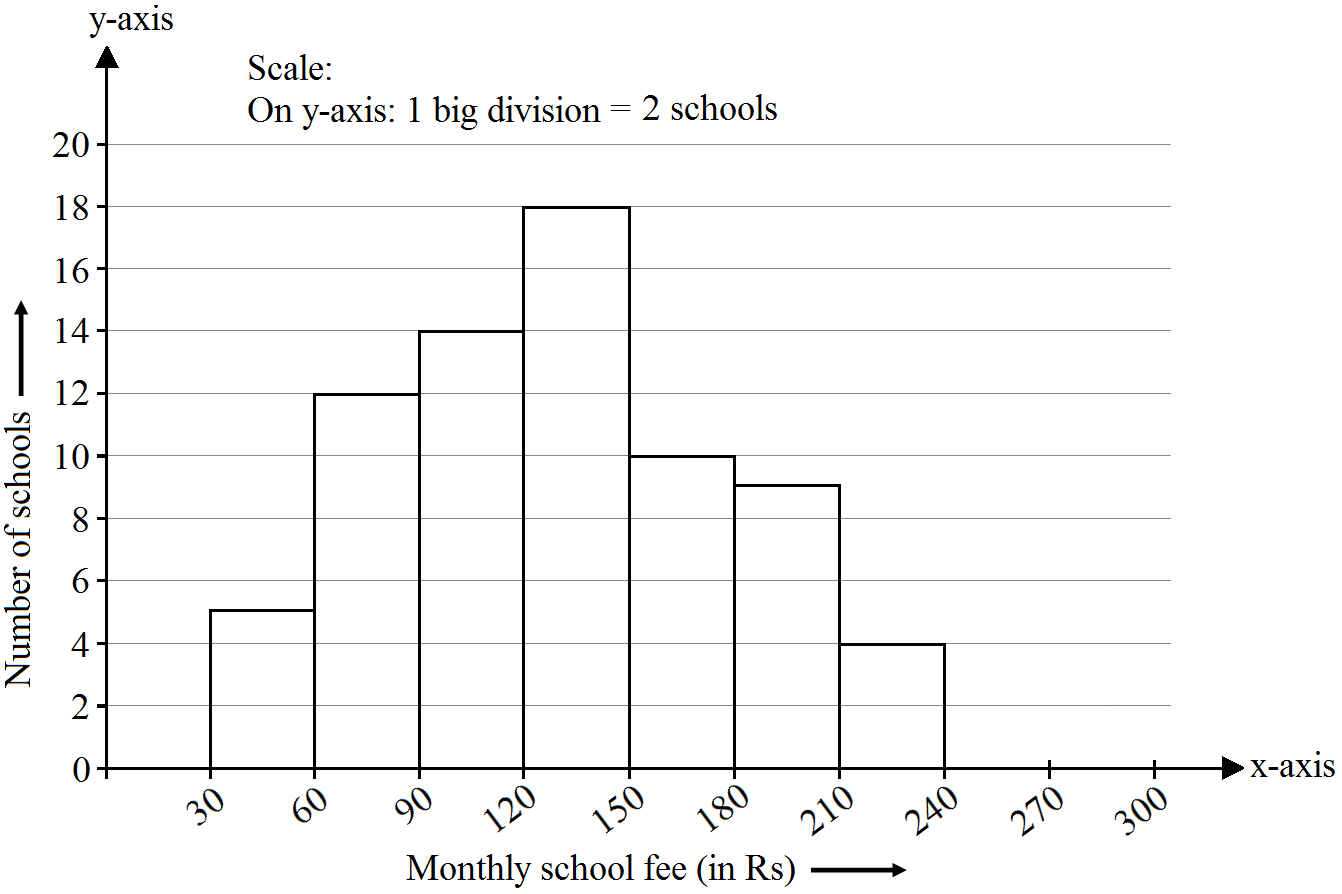
View full question & answer→Question 95 Marks
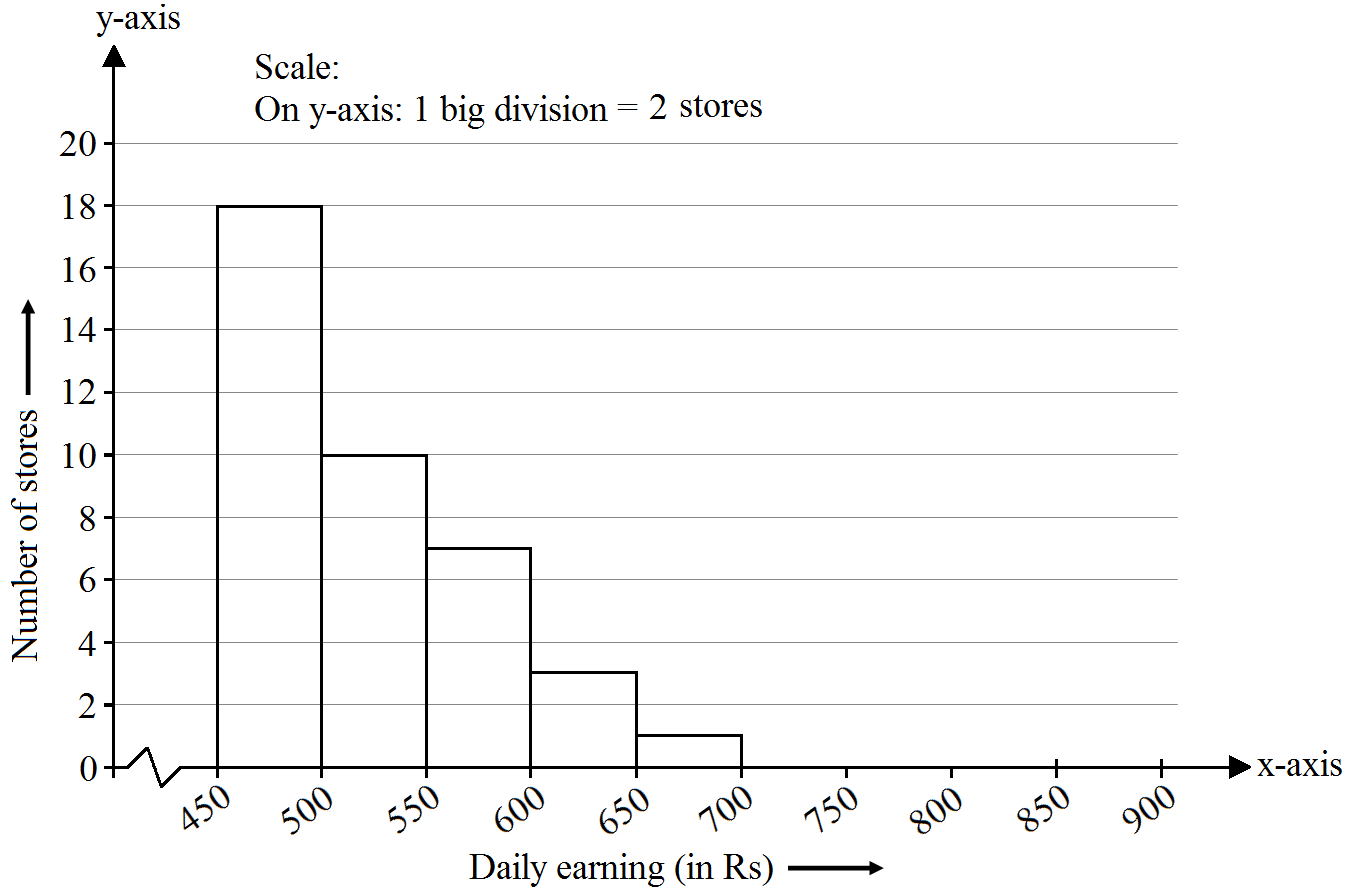
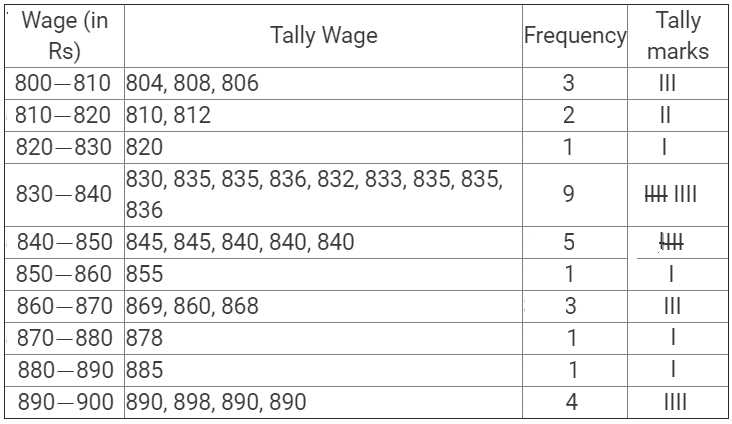
The weekly wages $($in $Rs.)$ of $30$ workers in a factory are given: $830, 835, 890, 810, 835, 836, 869, 845, 898, 890, 820, 860, 832, 833, 855, 845, 804, 808, 812, 840,$
$885, 835, 835, 836, 878, 840, 868, 890, 806, 840$ Mark a frequency table with intervals as $800-810, 810-820$ and so on, using tally marks. Also, draw a histogram and answer the following questions:
$i.$ Which group has the maximum number of workers?
$ii.$ How many workers earn $Rs. 850$ and more?
$iii.$ How many workers earn less than $Rs. 850$?
AnswerThe frequency table with intervals $800-820, 810-820, ........., 890-900$ is given below:
The class limits are represented along the $x-$axis and the frequencies along the $y-$axis on a suitable scale. Taking class intervals as bases and the corresponding frequencies as heights, the rectangles can be drawn to obtain the histogram of the given frequency distribution. The histogram is shown below:
$i.$ The group that has the maximum number of workers is represented as the highest rectangle. It is in the interval $830-840$
$ii.$ The number of workers who earn $Rs. 850$ or more can be calculated from frequency table in the following manner:
$1 + 3 + 1 + 1 + 4 = 10$
$iii.$ The number of workers who earn less than $Rs. 850$ can be calculated from frequency table in the following manner:
$3 + 2 + 1 + 9 + 5 = 20$ View full question & answer→Question 105 Marks
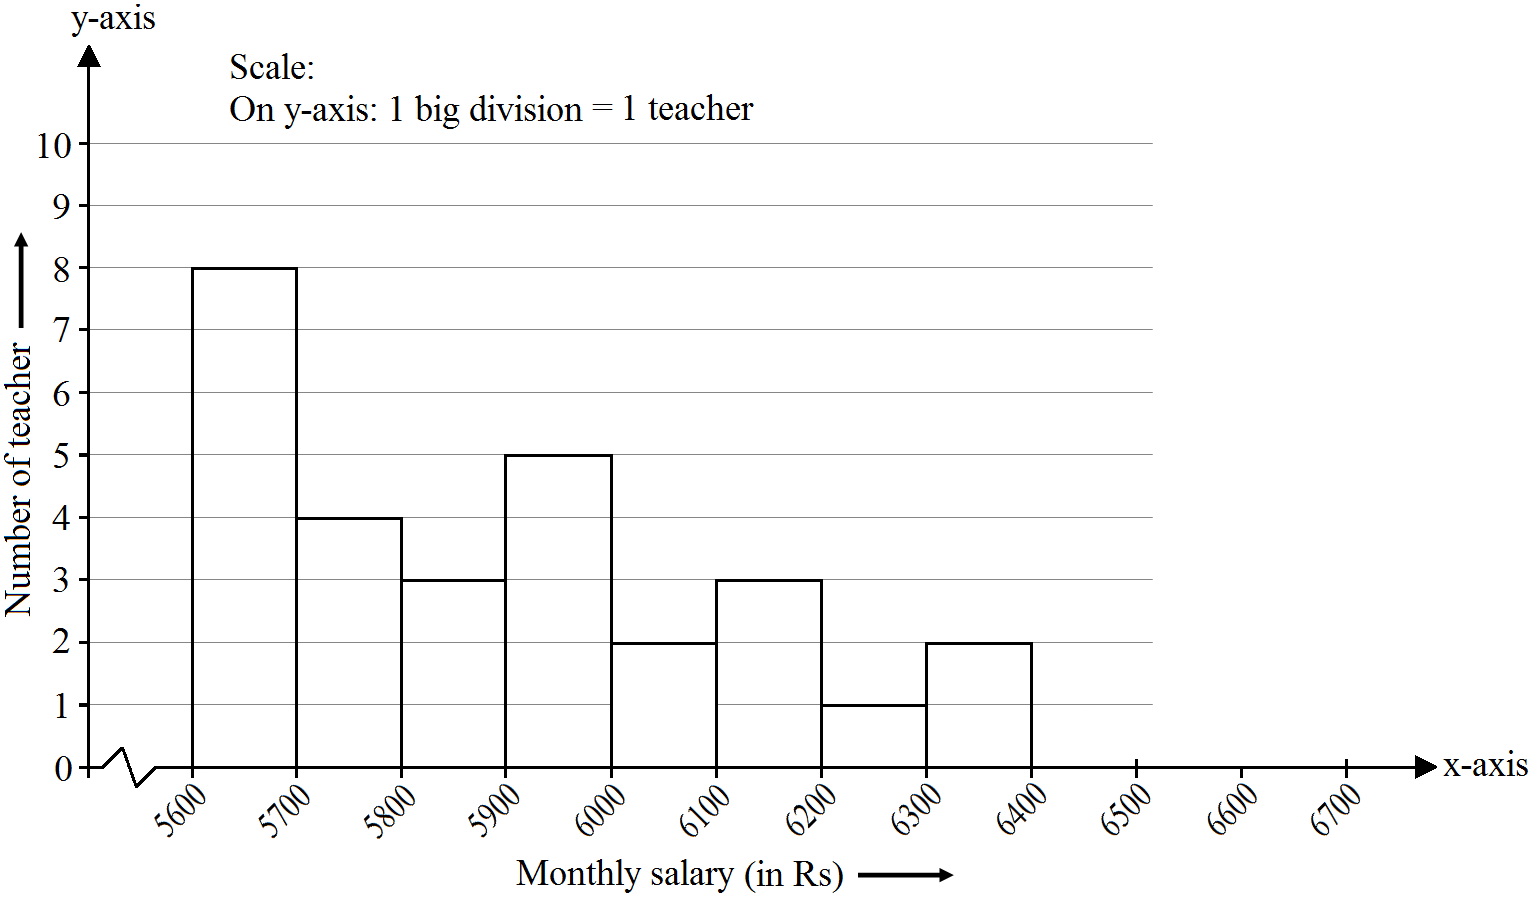
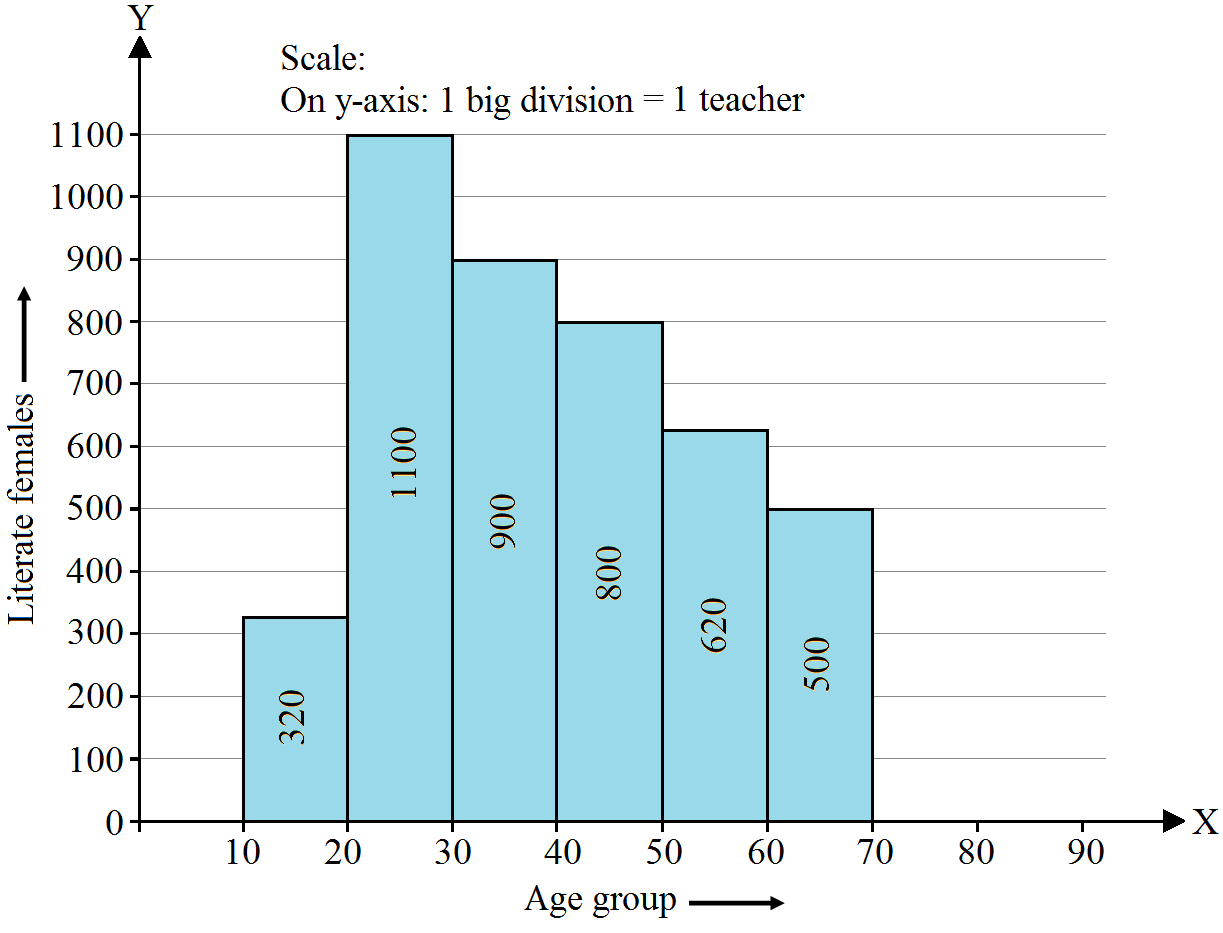
The following histogram shows the frequency distribution $f$ the ages of $22$ teachers in a school: 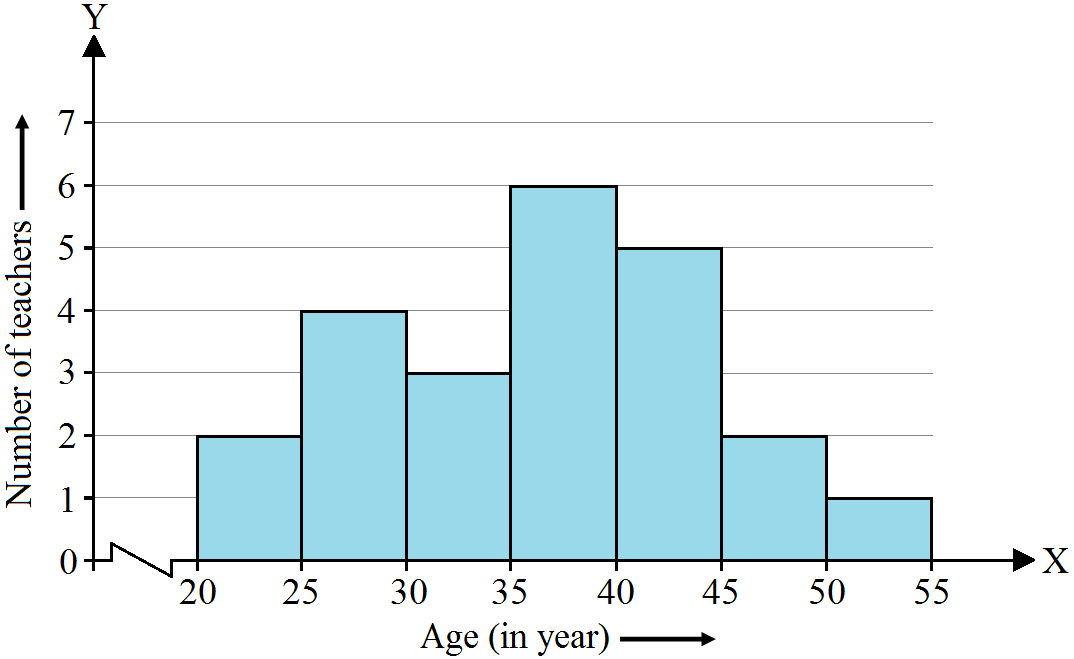
$i.$ What is the number of eldest and youngest teachers in the school?
$ii.$ Which age group teachers are more in the school and which least?
$iii.$ What is the size of the classes?
$iv.$ What are the class marks of the classes? Answer$i.$ The eldest $(50-55$ years$) = 1$ person
This is because the height of the rectangle with class interval $50-55$ as base is $1$ unit.
The youngest $(20-25$ years$) = 2$ persons
This is because the height of the rectangle with class interval $20-25$ as base is $2$ units.
$ii.$ The group containing the most number of teachers is $35-40$ years. This is because the height of the rectangle with class interval $35-40$ as base is the maximum.
The group containing the least number of teachers is $50-55$ years. This is because the height of the rectangle with class interval $50-55$ as base is the minimum.
$iii.$ Class size $=$ The range between the upper and the lower boundaries of the class.
For example, the size of the class $20-25$ years is $5$.
$iv. \text{Class mark}=\frac{\text{Upper limit }+\text{ Lower limit}}{2}$
For class $20-25:$
$\text{Class mark}=\frac{20+25}{2}=\frac{45}{2}=22.5$
Similarly, the class marks of the other classes are $27.5, 32.5, 37.5, 42.5, 47.5, 52.5$
View full question & answer→