Question 11 Mark
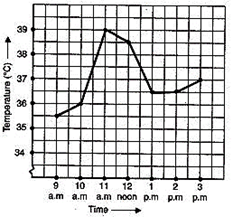
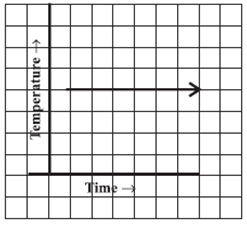
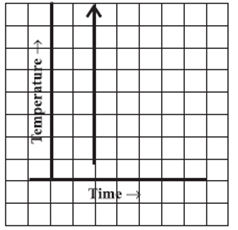
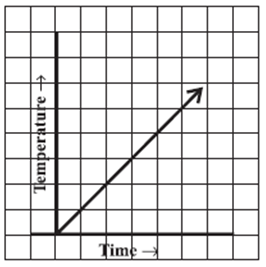
Can there be a time-temperature graph as follow? Justify your answer.
Answer
View full question & answer→From the graph, it is clear that this can be a time-temperature graph, as same temperature at different times is possible.
26 questions · self-marked practice — reveal the answer and mark yourself.

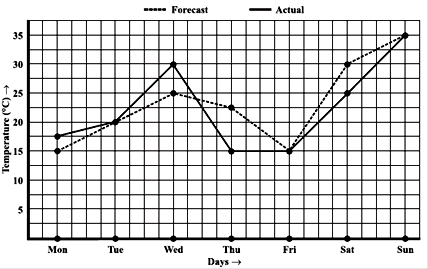
The given graph shows the temperature forecast and the actual temperature for each day of a week. On which days was the forecast temperature the same as the actual temperature?