Questions

4 Marks Questions

Take a timed test

4 questions · self-marked practice — reveal the answer and mark yourself.

Question 14 Marks
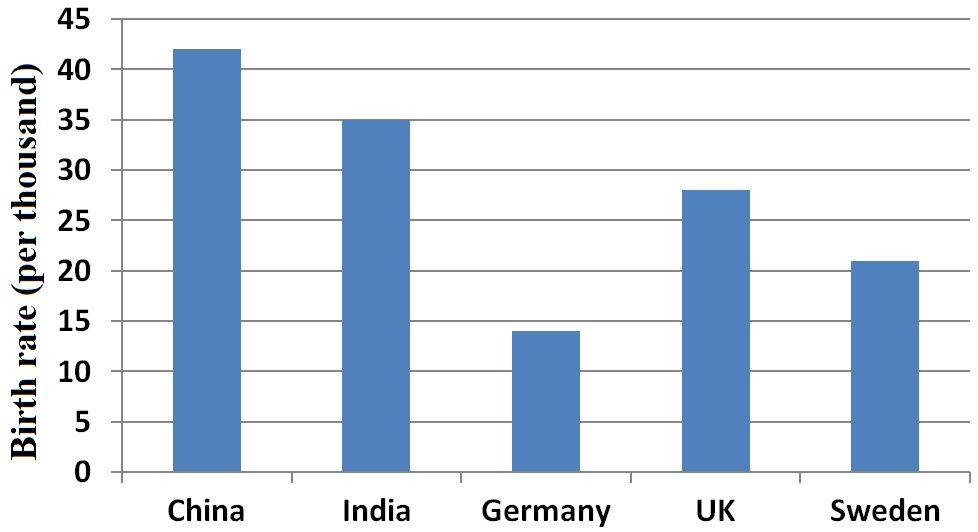
The birth rate per thousand in five countries over a pariod of time is shown below:
Country
China
India
Germany
UK
Sweden
Birth rate per thousand
$42$
$35$
$14$
$28$
$21$
Represent the above data by a bar graph.
Answer
Take the countries along the $x$-axis and the birth rate (per thousand) along the $y$-axis.
Along the $y$-axis, take $1$ big division $= 5$ units.
All the bars should be of same width and same space should be left between the consecutive bars.
Now we shall draw the bar chart, as shown below:
View full question & answer
Question 24 Marks
Given below is a table which shows the yearwise strength of a school. Represent this data by a bar graph.
Year
$2012-13$
$2013-14$
$2014-15$
$2015-16$
$2016-17$
Number of students
$800$
$975$
$1100$
$1400$
$1625$
View full question & answer
Question 34 Marks
The air distances of four from Delhi (in km) are given below:
City
Kolkata
Mumbai
Chennai
Hyderabad
Distance from Delhi (in km)
$1340$
$1100$
$1700$
$1210$
Answer
Take city aloong the $x$-axis and distance from Delhi (in km) along the $y$-axis. Along the $y$-axis, take $1$ big division $= 200$ units.
All the bars should be of same width and same space should be left between the consecutive bars.
Now we shall draw the bar chart, as shown below:
View full question & answer
Question 44 Marks
The following table shows the favourite sports of 250 students of a school. Represent the data by a bar graph.
Sports
Cricket
Football
Tennis
Badminton
Swimming
Number of students
$75$
$35$
$50$
$25$
$65$
Answer
Take the various types of sports along the x-axis and the number of students along the $y$-axis.
Along the $y$-axis, take $1$ small square = $10$ units.
All the bars should be of same width and same space should be left between the consecutive bars.
Now we shall draw the bar chart, as shown below:
View full question & answer