Question 12 Marks
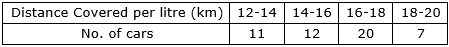
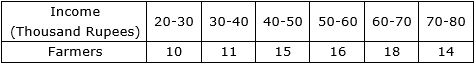
The following table shows the income of farmers in a grape season. Find the mean of their income.
Answer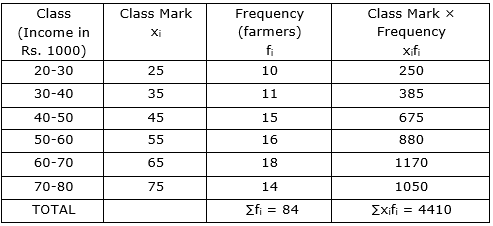
Mean is given by
Mean $=\frac{\sum x _{ i } f _{ i }}{\sum f _{ i }}$
⇒ Mean = 4410/84
⇒ Mean = 52.5
Now, since the income is given in thousand rupees.
Then, Mean = 52.5 × 1000
⇒ Mean = 52500
Thus, mean income is Rs. 52,500.
View full question & answer→Mean is given by
Mean $=\frac{\sum x _{ i } f _{ i }}{\sum f _{ i }}$
⇒ Mean = 4410/84
⇒ Mean = 52.5
Now, since the income is given in thousand rupees.
Then, Mean = 52.5 × 1000
⇒ Mean = 52500
Thus, mean income is Rs. 52,500.