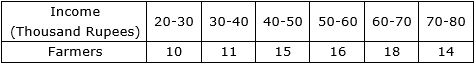
Question types

P-1 Statistics question types

168 questions across 3 question groups — pick any mix to generate a Maths paper with step-by-step answer keys.

168
Questions
3
Question groups
5
Question types
Sample Questions

P-1 Statistics questions

One sample from each question group in this chapter. Select any group above to see the full set with answer keys.

Find the correct answer from the alternatives given.

The above data is to be shown by a frequency polygon. The coordinates of the points to show number of students in the class 4-6 are . . . .
A. (4, 8)
B. (3, 5)
C. (5, 8)
D. (8, 4)
View full solution
Find the correct answer from the alternatives given.The median of the distances covered per litre shown in the above data is in the group $. . . . .$
 
  • A
    $12-14$
  • B
    $14-16$
  • $16-18$
  • D
    $18-20$

Answer: C.

View full solution
Find the correct answer from the alternatives given.
The formula to find mean from a grouped frequency table is $\bar{x}=A \frac{\sum f_i u_i}{\sum f_i} \times h g$
In the formula $u_i$ =……
A. $\frac{X_1+A}{g}$
B. $(x,-A)$
C. $\frac{X_1-A}{g}$
D. $\frac{A-X_i}{g}$
View full solution
The annual investments of a family are shown in the adjacent pie diagram. Answer the following questions based on it.
(1) If the investment in shares is Rs 2000/, find the total investment.
(2) How much amount is deposited in bank?
(3) How much more money is invested in immovable property than in mutual fund?
(4) How much amount is invested in post?
View full solution
The pie diagram in figure 6.13 shows the proportions of different workers in a town.
Answer the following questions with its help.
(1) If the total workers is 10,000; how many of them are in the field of construction?
(2) How many workers are working in the administration?
(3) What is the percentage of workers in production?
View full solution
The following table shows the percentages of demands for different fruits registered with a fruit vendor. Show the information by a pie diagram.
View full solution
In a tree plantation programme, the number of trees planted by students of different classes is given in the following table. Draw a pie diagram showing the information.
View full solution

Generate a P-1 Statistics paper free

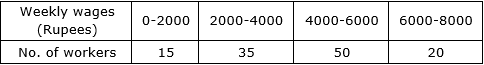
Pick question groups from the list above, set marks and difficulty, and export a branded PDF with step-by-step answer keys. First 3 chapters free — no signup.

Download App