Question 11 Mark
Answer
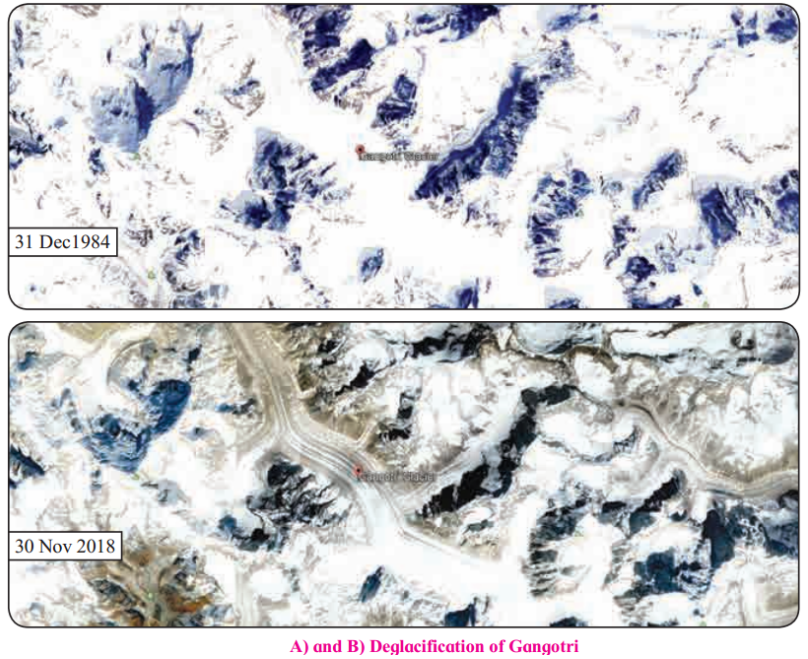
View full question & answer→Fig. 5.3 (A) shows the snow-covered Gangotri glacier area in Dec. 1984, whereas in Fig. 5.3 (B) the snow-covered region of the Gangotri glacier has retreated by 2018.
5 questions · self-marked practice — reveal the answer and mark yourself.
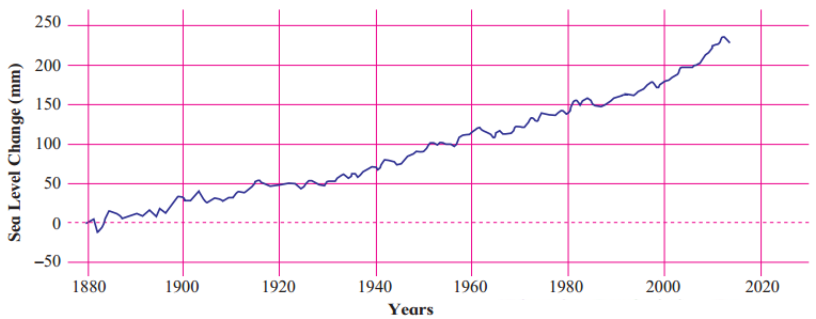
(1)What does the graph show?
(2)In which year is the change around 225 mm?
(3)What conclusions can you draw by seeing the graph?
(4)What correlation can be seen in this graph and the graph of rising temperature?