Question 15 Marks
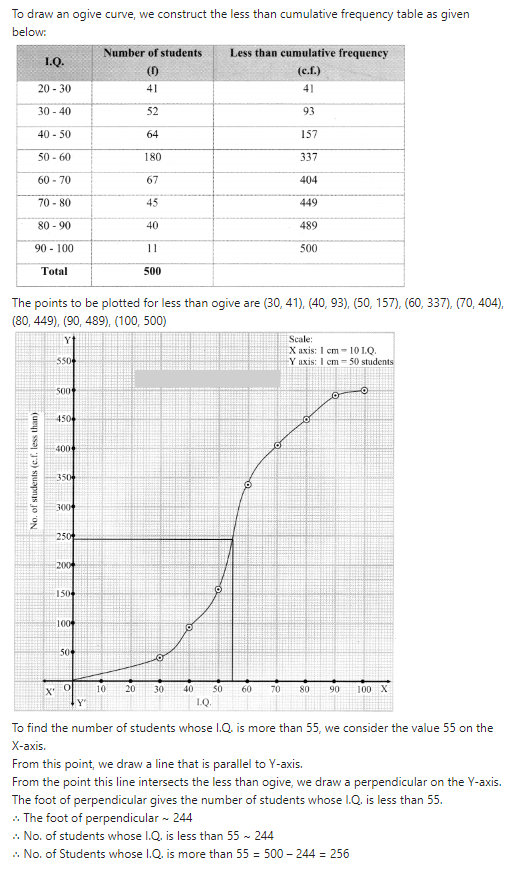
The I.Q. test of 500 students of a college is as follows:
Find graphically the number of students whose I.Q. is more than 55 graphically.
| I.Q. | 20-30 | 30-40 | 40-50 | 50-60 | 60-70 | 70-80 | 80-90 | 90-100 |
| Number Of Student | 41 | 52 | 64 | 180 | 67 | 45 | 40 | 11 |
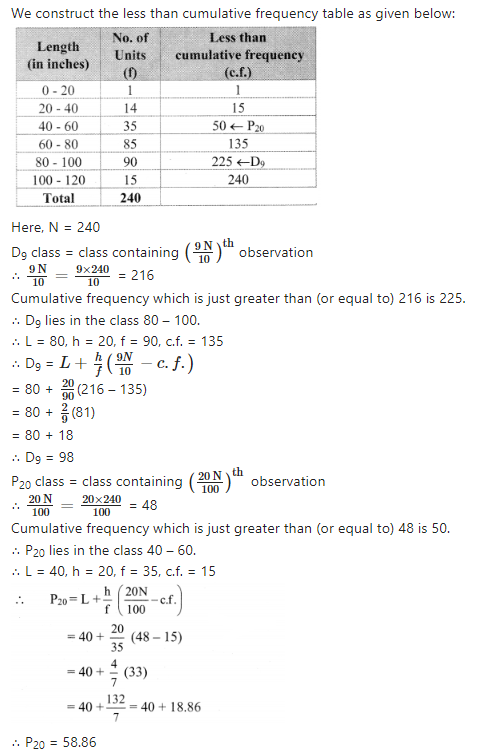
Answer
View full question & answer→Solution is as follows: