Question 14 Marks
Look at the bar graph given below:
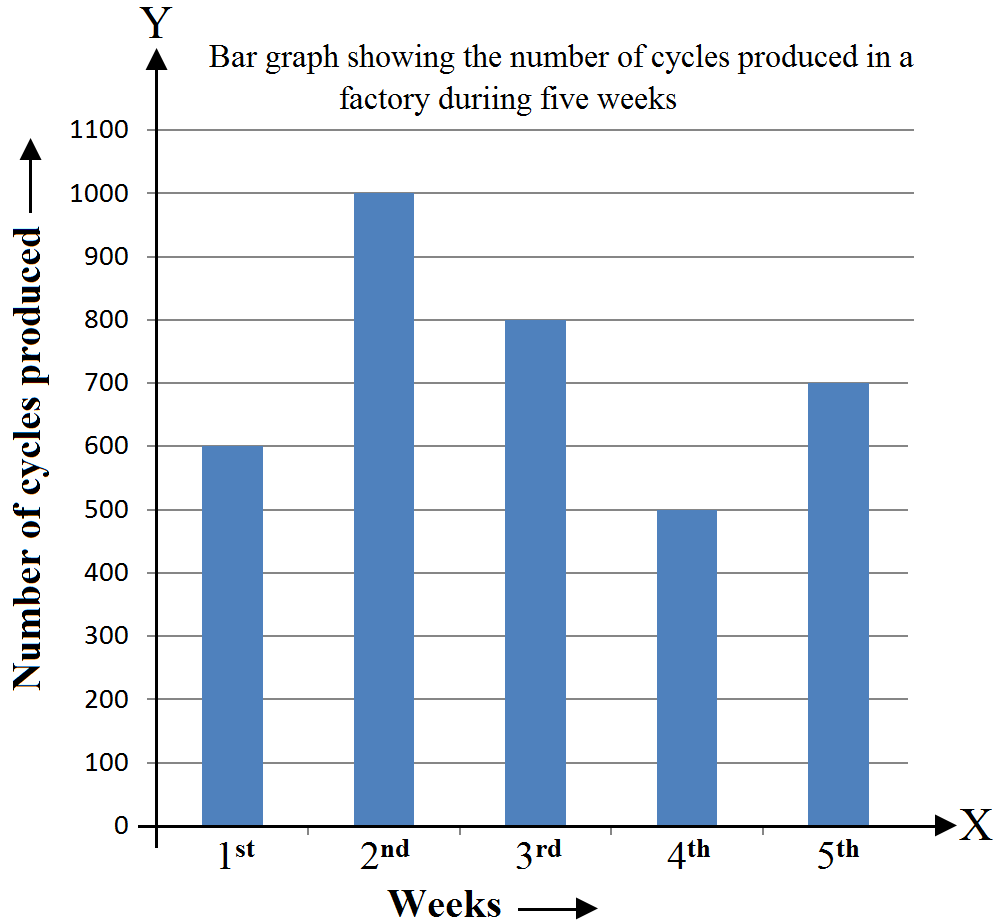
Bar graph showing the number of cycles produced in a factory during five weeks.
Study the bar graph carefully and answer the questions given below:
Bar graph showing the number of cycles produced in a factory during five weeks.
Study the bar graph carefully and answer the questions given below:
-
In which week was the production maximum?
-
In which week was the production minimum?
-
What is the average production during these five weeks?
-
How many cycles were produced in the first 3 weeks?
Answer
$=\frac{3600}{5}$
$=720$
$2400\ \text{cycles}$
View full question & answer→- Production was maximum in the 2nd week.
- Prodction was minimum in the 4th week.
- Average production of these five weeks $=\frac{\text{Total production of all weeks}}{\text{Number of weeks}}$
$=\frac{3600}{5}$
$=720$
- Number of cycles produced in the first 3 week = (Production in the 1st week + Production in the 2nd week + Production in the 3rd week)
$2400\ \text{cycles}$